
Designing a Scalable, AI-Powered Multi-Platform Cost Intelligence Experience
Tenant administrators managing cloud costs across Snowflake, Databricks, and other platforms face significant challenges due to the absence of a centralized, AI-powered, and dynamic interface. Without intelligent automation, current limitations hinder effective cost governance and optimization:
To deliver a scalable, AI-powered cost intelligence platform that transforms how enterprises monitor, manage, and optimize cloud expenditures across Snowflake, Databricks, and other systems.
• Centralize Visibility: Provide a unified, intuitive interface that consolidates multi-platform cost data for tenant admins, analysts, and FinOps stakeholders.
• AI-Driven Insights: Embed conversational AI flows to detect anomalies, explain cost trends, and recommend optimization strategies in real time.
• Enable Accountability: Support chargeback reporting by tag, org/unit, and platform, ensuring transparent cost allocation across diverse teams.
• Forecast & Optimize: Use predictive analytics to anticipate budget fluctuations and highlight savings opportunities before they impact spend.
• Enhance Decision-Making: Improve clarity and storytelling in dashboards, empowering proactive financial governance and strategic resource planning.
• Drive Efficiency: Reduce reliance on manual exports and reactive processes, fostering continuous optimization and operational excellence.
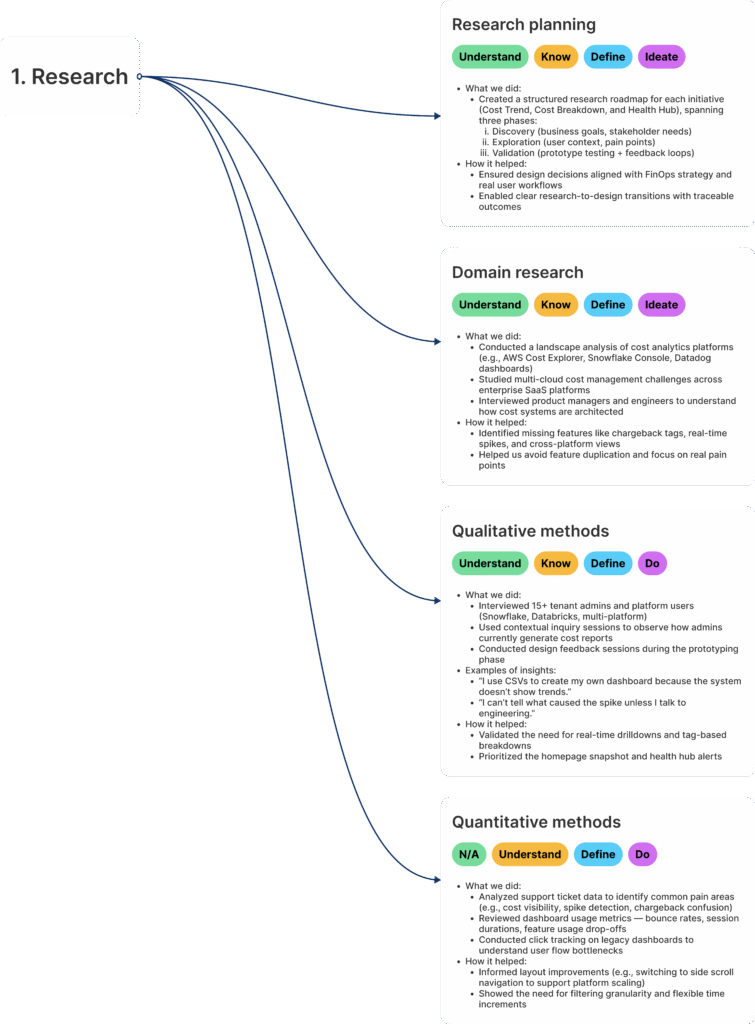
To guide design decisions, we employed a hybrid research approach that combined qualitative depth with quantitative validation:
Key Insights & Impact
The cloud cost management and FinOps landscape is rapidly evolving as enterprises accelerate multi-cloud adoption. With workloads distributed across platforms like Snowflake, Databricks, and internal compute systems, managing costs has become increasingly complex and mission-critical.
Market Pain Points
• Fragmented Visibility: No centralized view of spend across multiple platforms, leading to blind spots in governance.
• Inefficient Cost Allocation: Weak tagging practices and limited reporting tools hinder accurate chargeback and accountability.
• Root Cause Ambiguity: Difficulty connecting anomalies to underlying drivers such as failed jobs, scaling events, or inefficient queries.
• Static Reporting: Heavy reliance on CSV exports or third-party tools results in reactive rather than proactive optimization.
Our Differentiation & Value Proposition
• Unified Dashboards: A single platform view consolidating Snowflake, Databricks, and other systems for holistic visibility.
• AI-Powered Optimization Suggestions: Embedded intelligence highlights savings opportunities and inefficiencies in real time.
• Real-Time Usage & Health Indicators: Proactive monitoring surfaces anomalies and performance shifts before they escalate.
• Platform-Agnostic Tagging & Filtering: Flexible cost attribution across tags, org units, and platforms ensures transparency and accountability.The cloud cost management and FinOps landscape is rapidly evolving as enterprises accelerate multi-cloud adoption. With workloads distributed across platforms like Snowflake, Databricks, and internal compute systems, managing costs has become increasingly complex and mission-critical.
Market Pain Points
• Fragmented Visibility: No centralized view of spend across multiple platforms, leading to blind spots in governance.
• Inefficient Cost Allocation: Weak tagging practices and limited reporting tools hinder accurate chargeback and accountability.
• Root Cause Ambiguity: Difficulty connecting anomalies to underlying drivers such as failed jobs, scaling events, or inefficient queries.
• Static Reporting: Heavy reliance on CSV exports or third-party tools results in reactive rather than proactive optimization.
Our Differentiation & Value Proposition
• Unified Dashboards: A single platform view consolidating Snowflake, Databricks, and other systems for holistic visibility.
• AI-Powered Optimization Suggestions: Embedded intelligence highlights savings opportunities and inefficiencies in real time.
• Real-Time Usage & Health Indicators: Proactive monitoring surfaces anomalies and performance shifts before they escalate.
• Platform-Agnostic Tagging & Filtering: Flexible cost attribution across tags, org units, and platforms ensures transparency and accountability.
Primary Users
Key Responsibilities Across Platforms
Secondary Users
The CloudMetric platform is designed to move beyond static dashboards by embedding intelligence, transparency, and actionability into every workflow. Each feature was crafted to directly address user pain points uncovered in research and market analysis, ensuring admins, analysts, and FinOps teams can act faster and smarter.
AI is at the core of the CloudMetric experience, transforming static dashboards into interactive, intelligent cost management tools.
Key AI Capabilities
Impact
By embedding AI directly into the dashboard, CloudMetric shifts cost management from reactive reporting to proactive intelligence, empowering teams to act faster, optimize smarter, and communicate insights more effectively across the enterprise.
Enable precise cost allocation and accountability
through flexible, platform-agnostic tagging and chargeback capabilities.
Key Capabilities
Impact
This feature transforms chargeback from a manual, error-prone process into a streamlined, transparent system, empowering FinOps teams to enforce accountability, improve forecasting, and drive cost efficiency across the enterprise
Transform monitoring into proactive intelligence by surfacing real-time alerts that connect cost anomalies with system health.
Key Capabilities
• Real-Time Alerts: Automatically flag anomalies such as sudden cost spikes, failed jobs, or scaling inefficiencies.
• Contextual Insights: Pair alerts with diagnostic details (e.g., workload, object-level performance, or query failures) to accelerate root cause analysis.
• Customizable Thresholds: Allow admins and FinOps teams to set alert rules based on spend limits, performance metrics, or tagging structures.
• Multi-Platform Coverage: Provide unified alerts across Snowflake, Databricks, and other systems, eliminating siloed monitoring.
• AI-Enhanced Detection: Use machine learning to identify patterns, predict potential issues, and reduce false positives.
• Actionable Recommendations: Suggest remediation steps directly within the alert card, enabling faster resolution and cost optimization.
Impact
Health Hub Alert Cards shift the platform from passive reporting to active monitoring, empowering teams to catch issues early, reduce downtime, and optimize spend with confidence
Deliver instant visibility into cost efficiency opportunities
with AI-powered snapshots and actionable insights that guide proactive decision-making.
Key Capabilities
Impact
Optimization Snapshot & Insights transforms dashboards into decision engines, enabling teams to move from reactive monitoring to proactive cost governance. By surfacing clear recommendations and quantifying potential savings, the feature empowers FinOps, DevOps, and platform leads to drive efficiency at scale
To gather quantitative data for the “AI Toolbox” project, crafting focused questions that can be quantitatively analyzed is crucial. Below are five quantitative research questions along with hypothetical answers based on a survey of potential users. These responses are accompanied by observations to provide insights into user needs and preferences.
Answer Options:
Daily
Weekly
Monthly
Only during audits
Rarely
Hypothetical Responses:
Daily: 18%
Weekly: 46%
Monthly: 25%
During audits: 8%
Rarely: 3%
📝 Observation:
Most users access dashboards weekly, suggesting that default views should prioritize weekly time increments and make it easy to scan changes over that period. Daily or real-time views should remain secondary for advanced users.
Answer Options:
By Platform
By Tags (e.g., AI/ML, DevOps)
By Workspace
By Business Unit / Org
By Account
I don’t use breakdowns
Hypothetical Responses:
Platform: 58%
Tags: 44%
Workspace: 36%
Business Unit: 51%
Account: 22%
No breakdown: 6%
📝 Observation:
Platform and Business Unit filters are essential, but strong interest in tag-level filtering validates our chargeback-focused design. Workspace-level breakdowns are useful for developers and should be included in object-level detail views.
Answer Options:
Use trend graphs
Filter by platform/org/unit
Drill into object detail pages
Export CSV and analyze externally
Ask DevOps for help
Ignore unless flagged
Hypothetical Responses:
Trend graphs: 42%
Filter platform/org: 34%
Object detail: 15%
Export CSV: 7%
Ask DevOps: 1%
Ignore: 1%
📝 Observation:
Users rely heavily on graphs and filters. This validated our decision to place visuals first, followed by contextual filters and drill-downs. It also confirmed that Change History and Object Detail Pages should only be a click away.
Answer Options:
Graph view
Table view
Toggle between both
Neither – I prefer exporting
Doesn’t matter
Hypothetical Responses:
Graph view: 28%
Table view: 24%
Toggle both: 43%
Export: 4%
Doesn’t matter: 1%
📝 Observation:
Users want control over their data view, with the majority preferring a toggle between graph and table. This justified building a seamless toggle feature that retains filters and state between views.
Answer Options:
Very helpful
Somewhat helpful
Neutral
Not enough filtering
Too many filters – it’s overwhelming
Hypothetical Responses:
Very helpful: 20%
Somewhat helpful: 38%
Neutral: 14%
Not enough: 22%
Too many: 6%
📝 Observation:
While filters are appreciated, 22% say filtering is still insufficient. This led us to prioritize multi-layer filtering (e.g., time + platform + tag + org) and add global + local filter controls to improve flexibility.
Answer Options (multi-select):
Optimization suggestions
Health indicators (failures, retries)
Predictive trends
Slack/email notifications
None – I prefer manual analysis
Hypothetical Responses:
Real-time alerts: 48%
Optimization suggestions: 62%
Health indicators: 44%
Predictive trends: 38%
Notifications: 27%
None: 3%
Observation:
Users desire smarter, AI featured assistance, actionable dashboards, not just visualizations. This insight directly led to the creation of the Health Hub, as well as optimization cards and system alerts tied to usage anomalies.
Impact:
Users managing multiple platforms (Snowflake, Databricks) had to switch between tools or export data into spreadsheets to compare costs. This slowed decision-making and introduced errors in analysis.
Solution:
We built a unified multi-platform dashboard with toggles for platform selection, consistent visual patterns, and shared filters. Users could now analyze costs, trends, and breakdowns across all platforms in one place.
Impact:
Admins couldn’t proactively detect cost anomalies or surface savings insights. Spikes often went unnoticed until after budgets were exceeded.
Solution:
We introduced a Health Hub and Optimization Snapshot module that flagged failed jobs, retry spikes, and savings from Databolt. Visual alert cards allowed users to act before problems escalated.
Impact:
Users relied on outdated exports or weekly syncs to track spend. Static views didn’t reflect dynamic scaling or real-time workload costs.
Solution:
Designed a dynamic Cost Trends module with time controls (daily/weekly/monthly), real-time graphs, and platform/org-based breakdowns. This enabled teams to spot fluctuations early and react with context.
Impact:
Financial operations teams couldn't easily segment costs by team, function, or initiative. Manual chargeback reports were time-consuming and inconsistent.
Solution:
Built a Cost Breakdown view with tag filters (e.g., AI/ML, DevOps), business unit selectors, and exportable reports. This empowered users to attribute costs confidently and streamline internal billing.
Impact:
Without AI-driven capabilities, tenant admins and FinOps teams are forced into manual analysis of anomalies, exports, and reports. This slows down decision-making, increases the risk of missed optimization opportunities, and leaves organizations reacting to cost issues rather than preventing them.
Solution:
Embed AI-powered intelligence directly into the dashboard to:
Impact:
Some users preferred tables for exact values, while others relied on visuals for pattern recognition. Having only one view limited usability.
Solution:
Enabled Graph vs. Table toggle across all major views, with synchronized filters and export options. This dual-mode flexibility improved adoption across user types.
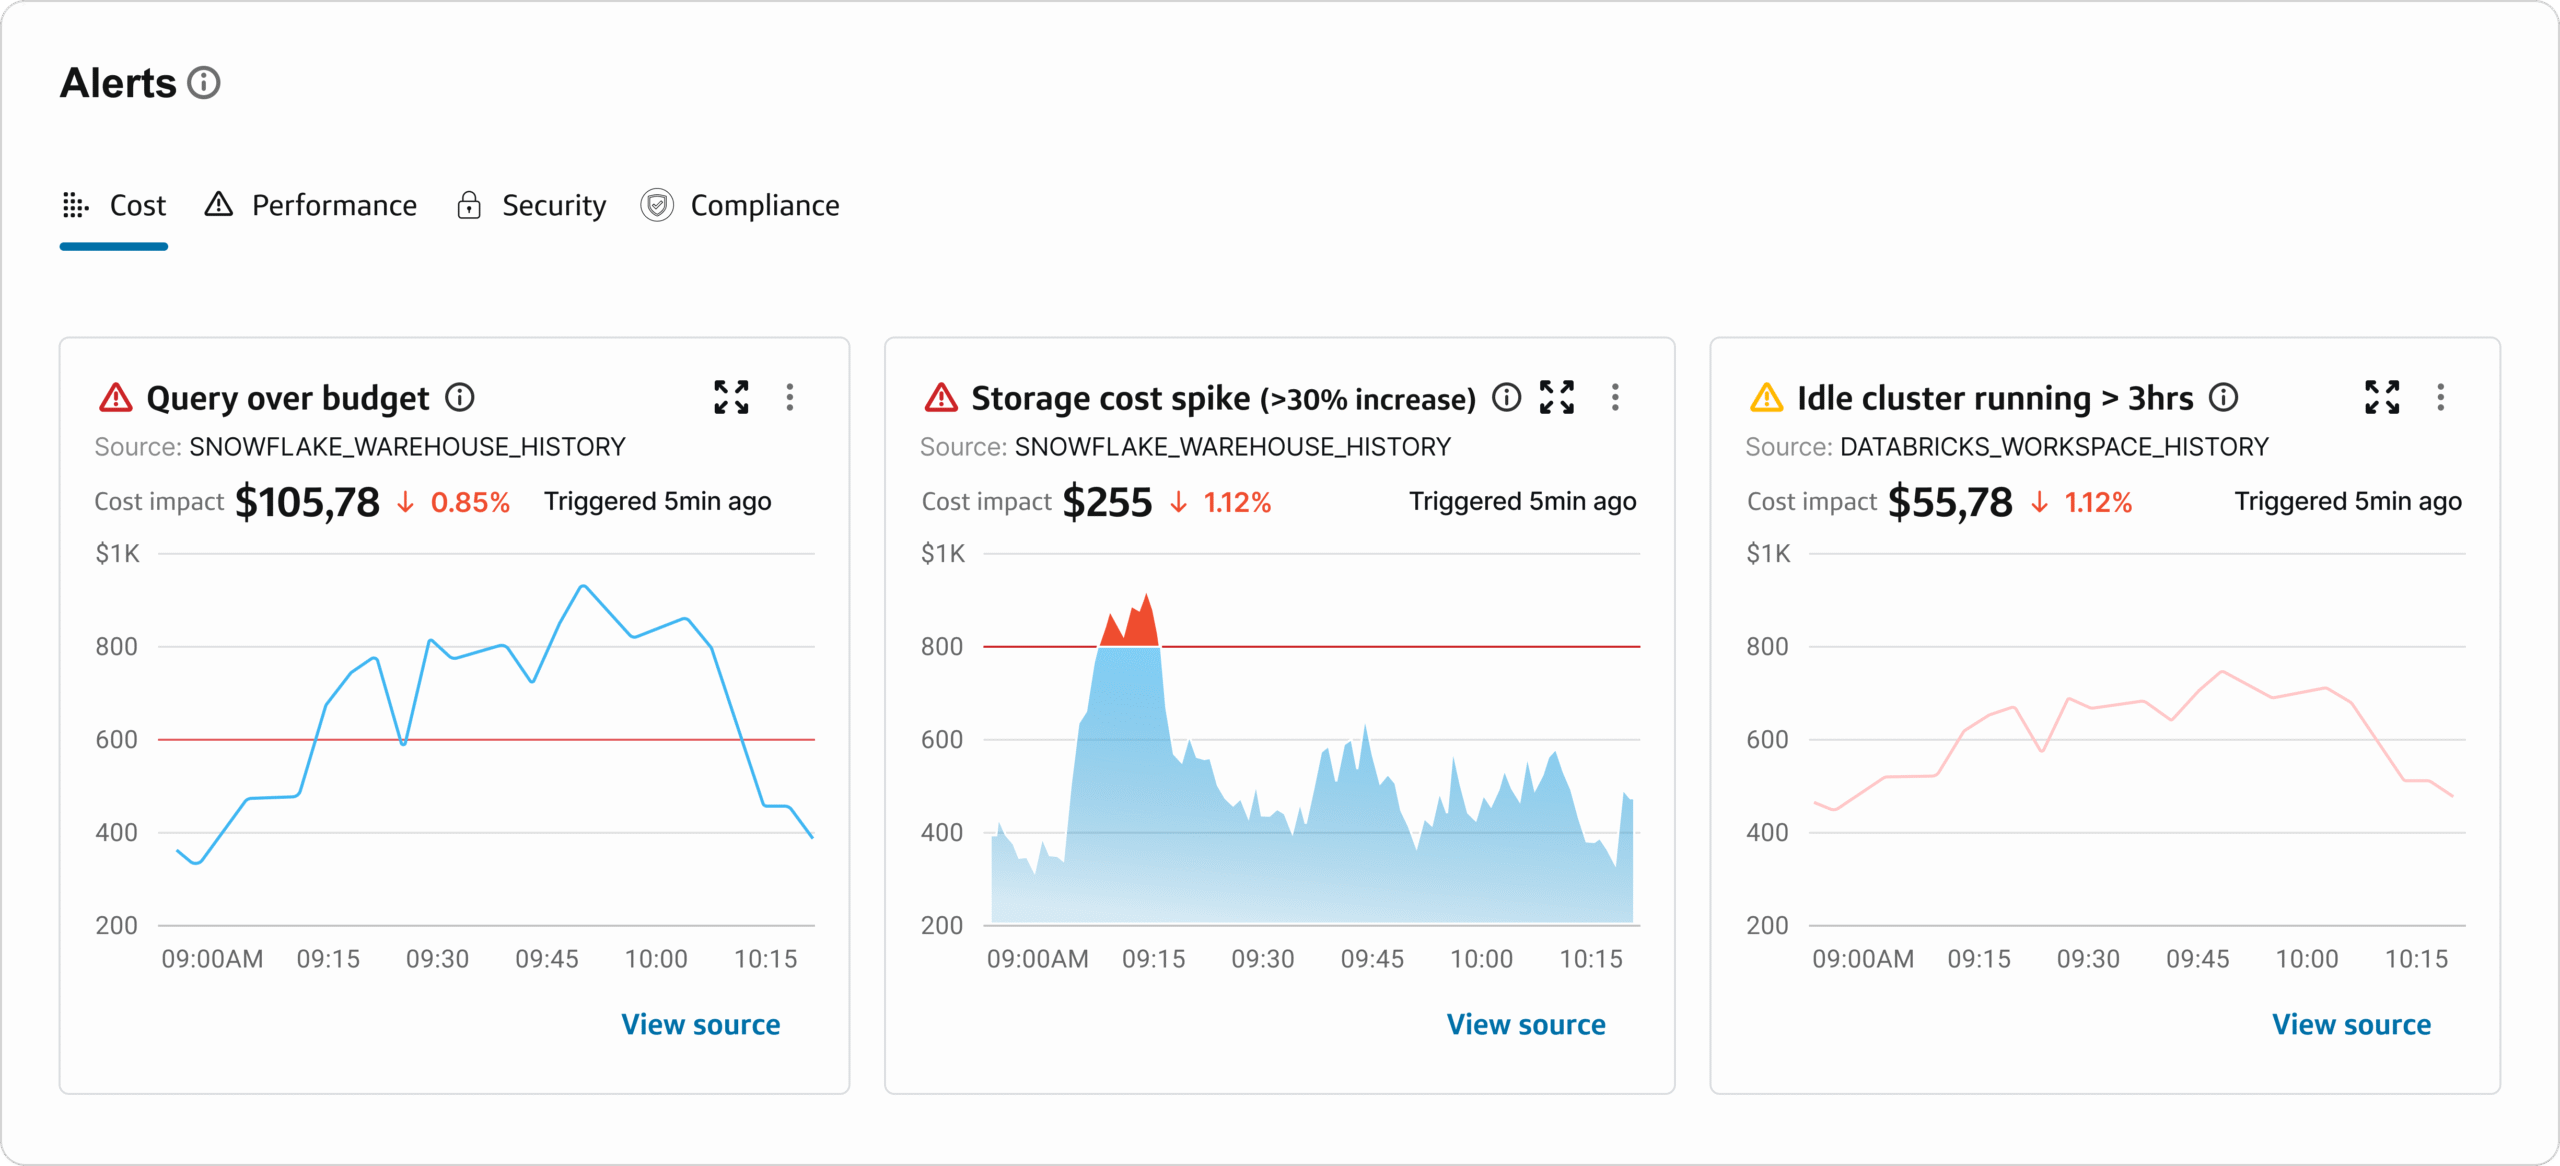

To empower platform admins with immediate, actionable insights, we implemented a real-time alert module embedded directly within the cost dashboard. These alerts proactively surface anomalies and inefficiencies that require urgent attention—helping teams minimize waste and maintain cost control across platforms like Snowflake and Databricks.
Each alert card follows a consistent layout, ensuring clarity and scannability:
Categorization Tabs:
Users can toggle between Cost, Performance, Security, and Compliance alerts—providing focused monitoring.
Alert Type & Severity Icon:
Visual icons (e.g., red triangle, yellow warning) immediately communicate the nature and urgency of the issue.
Source Context:
Alerts clearly display the data source (e.g., SNOWFLAKE_WAREHOUSE_HISTORY, DATABRICKS_WORKSPACE_HISTORY) for traceability.
Cost Impact Metrics:
Large font dollar values show the exact financial impact, paired with % change (red downward arrow) to highlight the deviation severity.
Embedded Graph Visualization:
A mini time-series graph shows when the spike or anomaly occurred—providing instant temporal context without leaving the card.
Timestamped Trigger Info:
Each alert includes a “Triggered X min ago” label for real-time situational awareness.
Call to Action:
A View source link allows the user to jump directly into the raw data or detail page to investigate further.
In the context of complex cost monitoring and optimization workflows, surface-level dashboards are not enough. Users need to investigate root causes, track historical changes, and act quickly on anomalies—all without losing context. This is where our Side Panel architecture becomes critical.

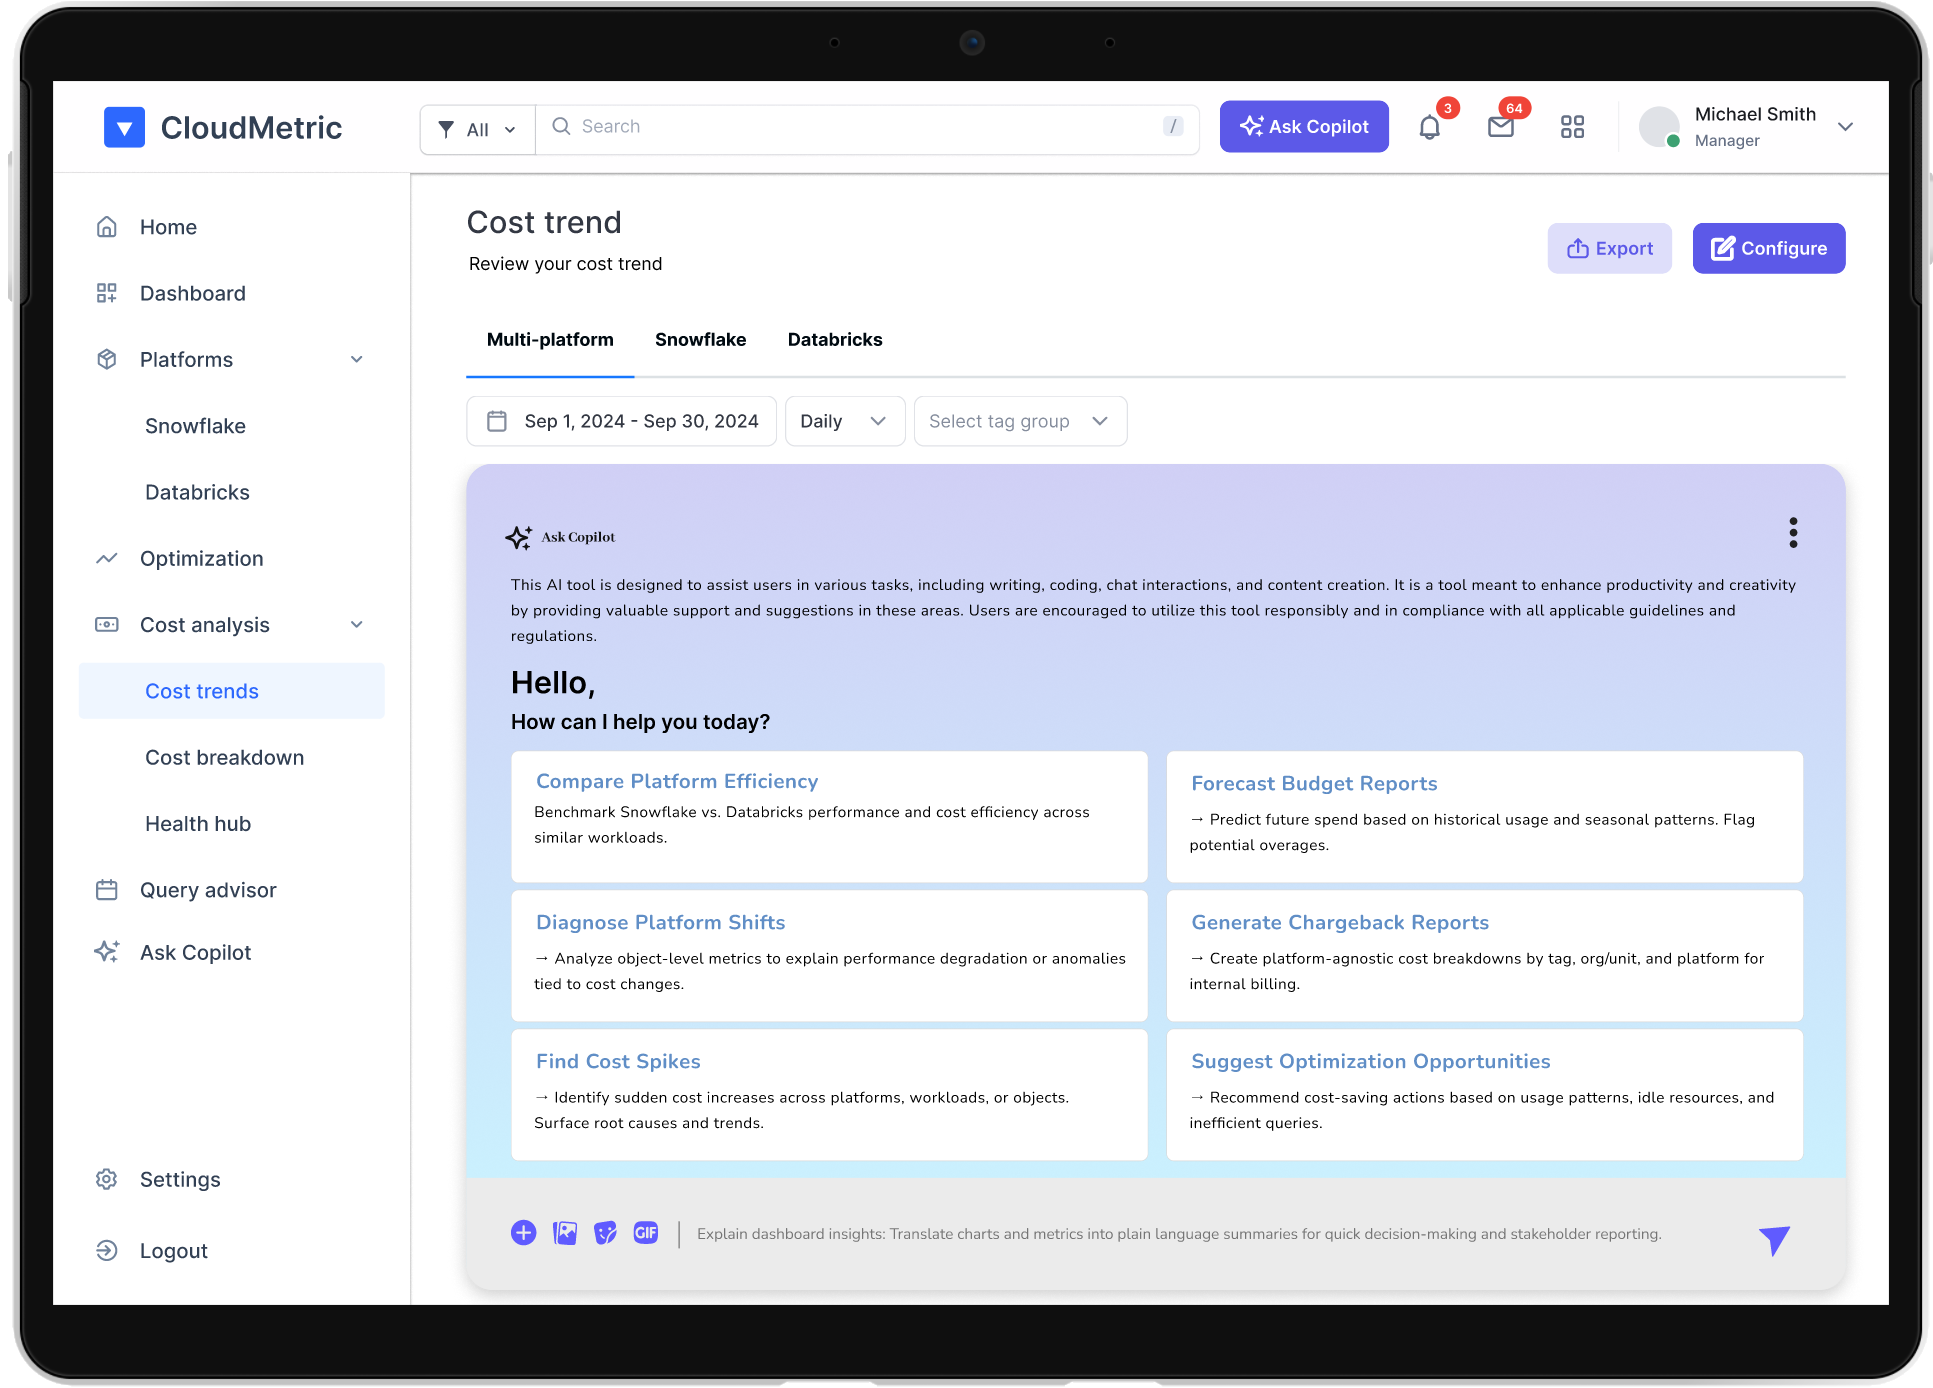
Integrated a conversational AI assistant to elevate user interaction, streamline workflows, and surface actionable insights across cost management modules. Key contributions include: • Designed contextual AI flows tailored to cloud cost analysis, enabling users to ask natural-language questions and receive intelligent, platform-aware responses. • Built internal chatbot tooling that supports tasks like cost spike detection, chargeback report generation, and performance diagnostics—reducing manual effort and accelerating decision-making. • Enabled real-time guidance within dashboards, helping users interpret trends, compare platform efficiency, and uncover optimization opportunities without leaving the interface. • Developed modular AI actions such as “Find Cost Spikes,” “Forecast Budget,” and “Diagnose Platform Shifts,” making complex analysis accessible to non-technical stakeholders. • Enhanced productivity by embedding AI-driven suggestions directly into cost trend views, allowing users to move from insight to action seamlessly. • Improved storytelling and clarity through AI-generated summaries and explanations of dashboard metrics, supporting better communication across FinOps, DevOps, and business teams.


Dynamic visualizations of cost behavior over time, including: Platform-to-platform comparisons Cost by workspace, org/unit, account, and type Ability to switch time increments (daily, weekly, monthly)

Designed for chargeback and cost attribution, this view: Breaks down cost by tags across all platforms Enables cost allocation reporting across cross-functional units Supports filtering by platform, org, and business unit


Proactive cost governance feature: Summarizes cost spikes, failed jobs, high retry counts, and system health Includes visual alerts on objects needing attention Encourages pre-emptive actions before major cost increases

In the context of complex cost monitoring and optimization workflows, surface-level dashboards are not enough. Users need to investigate root causes, track historical changes, and act quickly on anomalies—all without losing context. This is where our Side Panel architecture becomes critical.

To gather quantitative data for the “AI Toolbox” project, crafting focused questions that can be quantitatively analyzed is crucial. Below are five quantitative research questions along with hypothetical answers based on a survey of potential users. These responses are accompanied by observations to provide insights into user needs and preferences.
Creating configurable dashboards, graph/table toggles, and per-graph filters empowered different types of users—from executive stakeholders to platform engineers—to tailor the interface to their workflow needs without overwhelming others.
By consolidating Snowflake, Databricks, and internal platform data into one centralized experience, we helped eliminate tool-switching, reduced data silos, and accelerated decision-making for tenant admins and FinOps teams.
Dynamic trend graphs, real-time breakdowns, and contextual tooltips improved comprehension and trust—turning passive dashboards into interactive tools for action and strategy.
Quantitative surveys and qualitative interviews directly informed everything from filter controls to layout hierarchy. Listening to users guided prioritization and helped reduce time-to-adoption post-launch.
The introduction of the Health Hub, change history panels, and optimization snapshots allowed users to prevent problems rather than diagnose them later—shifting the experience from reactive to predictive.
Consistency in patterns, clarity in visual hierarchy, and precision in UI details (like tooltips and time increments) quietly improved usability and scaled the experience to complex data scenarios—without ever overwhelming users.