


“How might we improve riders’ experience and encourage more riders?

First, when I start a new project in the first phase, I try to understand and audit the existing application to see the root of the current problems. In the Project kick-off meeting, we asked some critical questions to stakeholders to better understand their issues. The problem is: “How might we improve riders’ experience and encourage more riders?
Empathize with users by speaking with them directly
User Interview
Identify and narrow users' pain points
Afiinity mapping
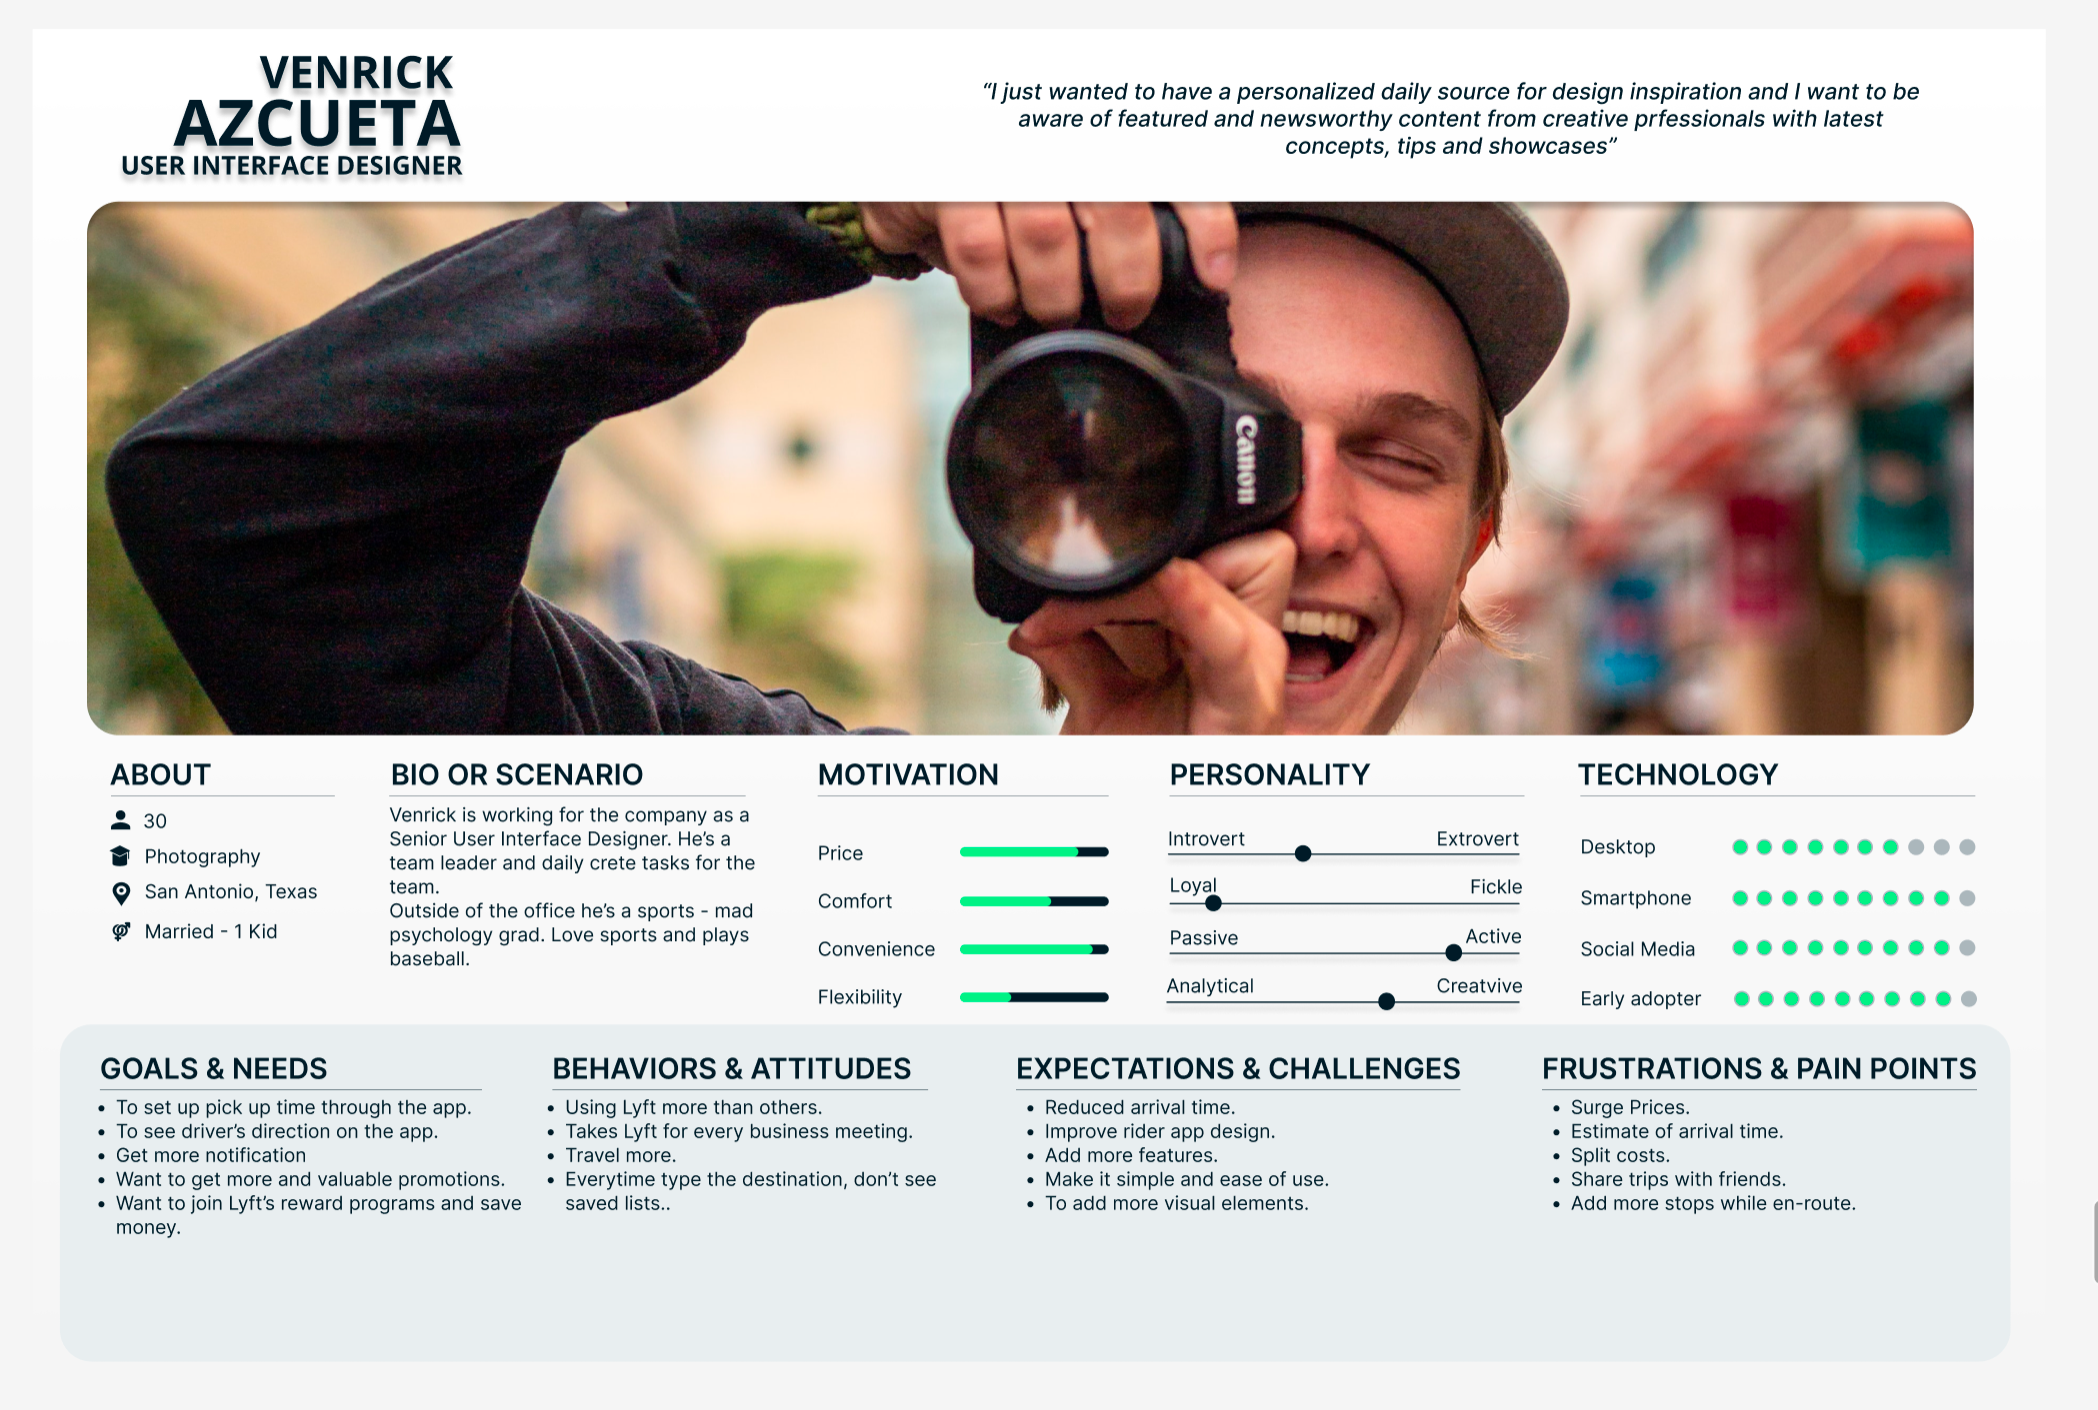
User Persona
User Journey
Conceptualize solution that solves user pain points and mapping all of them
Competitive analysis
Task Flow
User Flow
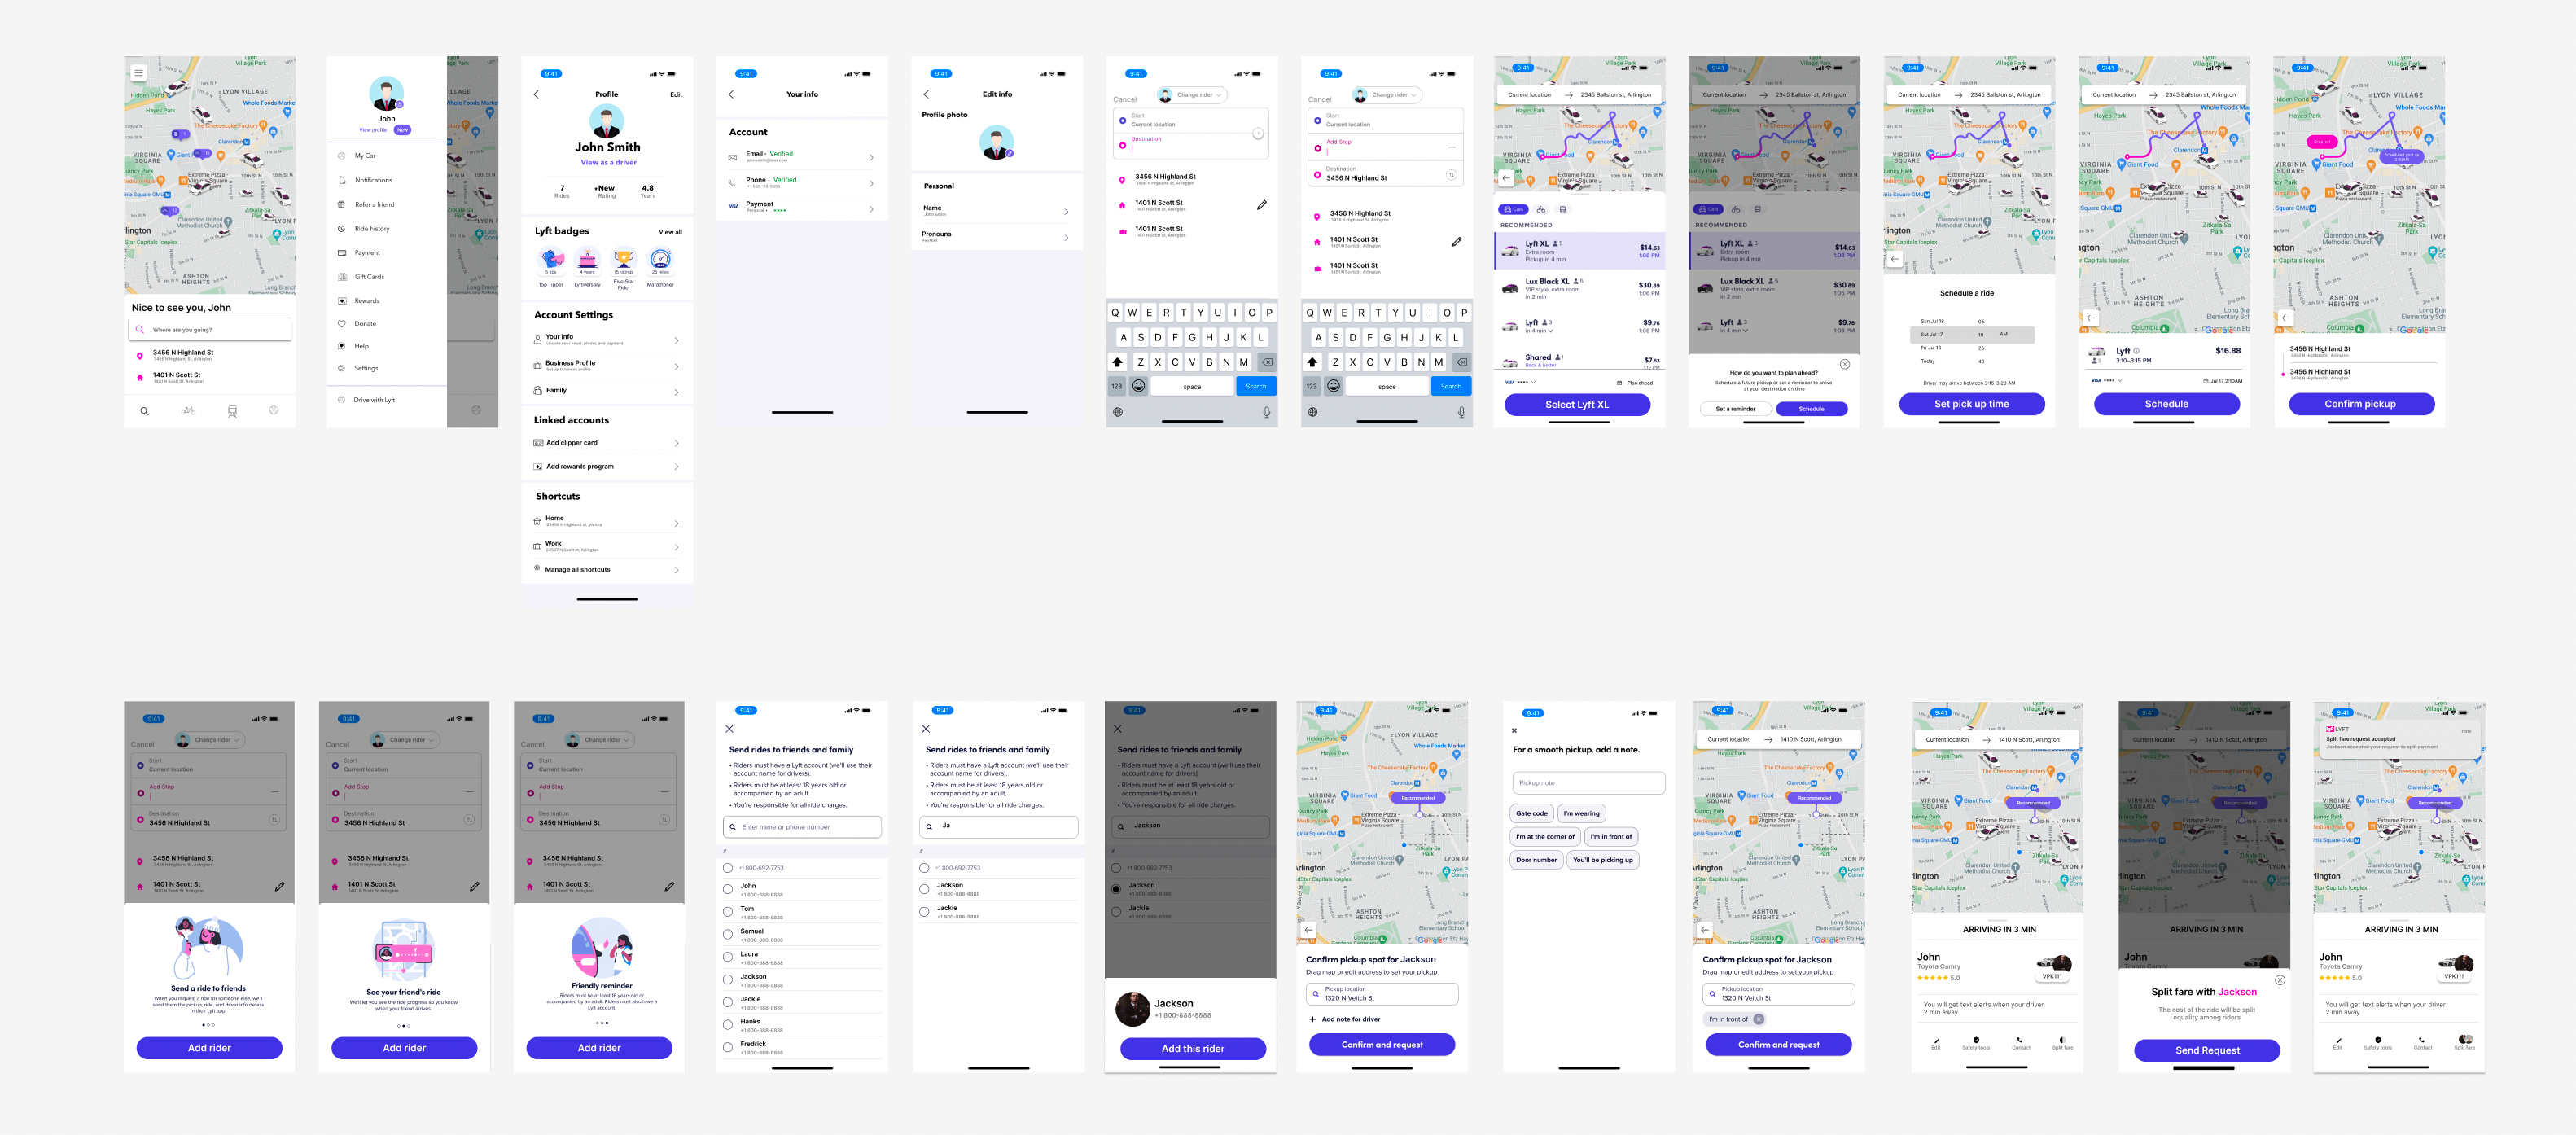
Create Lo, Mid and High Fidelity maps, wireframing, prototyping, usability testing
Wireframe
Prototype
Usability Test
Wireframing, Prototyping, LO, MID, HI-FI Mapping, UI components
Usability Test
Brainstorming, mapping and team collaboration
Interviews, Team meetings

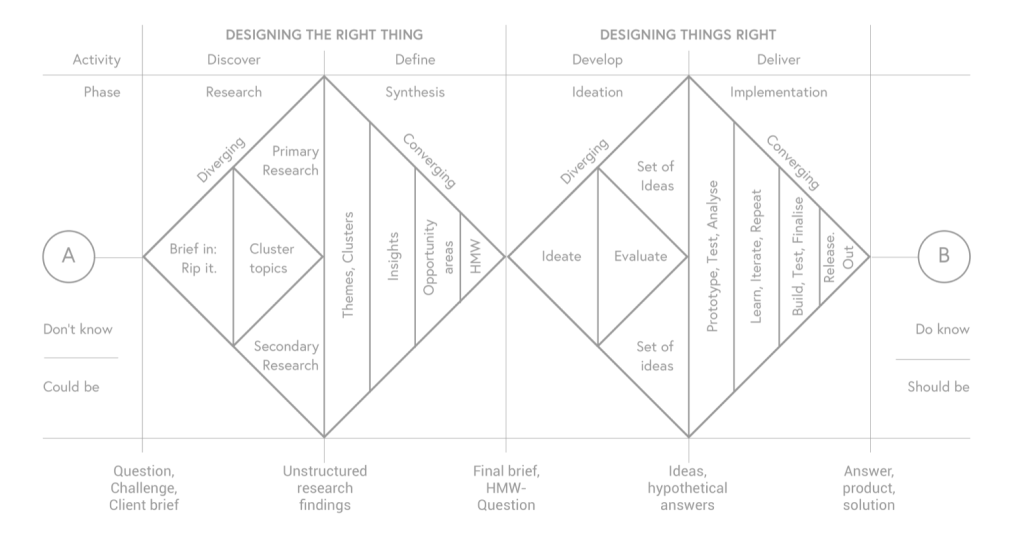
When I started the project, as always, I used Dan Nessler’s Design Thinking Double Diamond to break out the whole process into Discover, Define, Develop, and Deliver phases.
The main goal of this project is to solve riders’ pain points by adding new features and services. These features and services, will help the riders to split their costs, reduce higher prices, save their time and money.
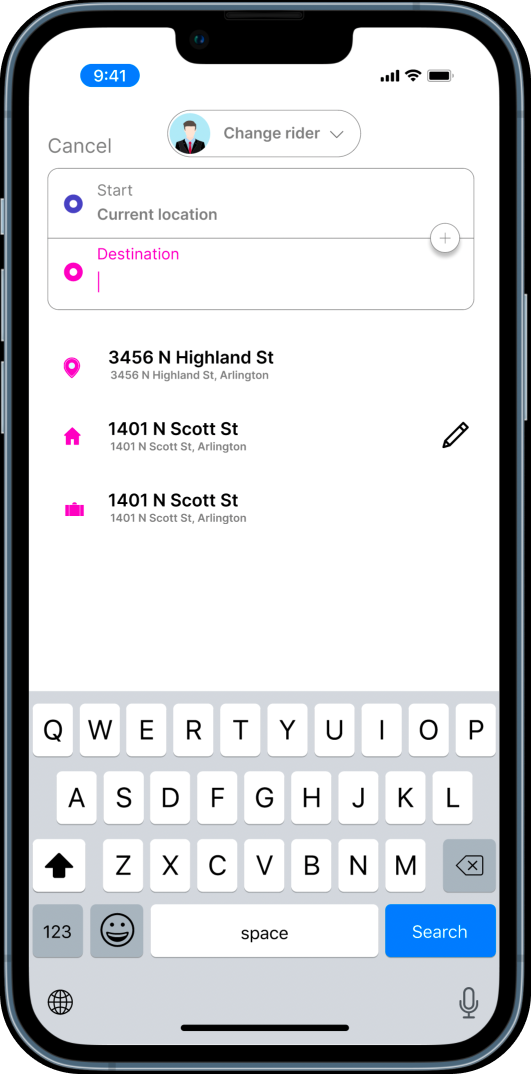
“Add rider” will help riders to share their rides with friends, family members etc. and split their costs
“Add destination” will help riders to add one or more destination without complete the trip.
“Schedule pick up” will help riders to schedule their pick up time upfront, save their time and money.
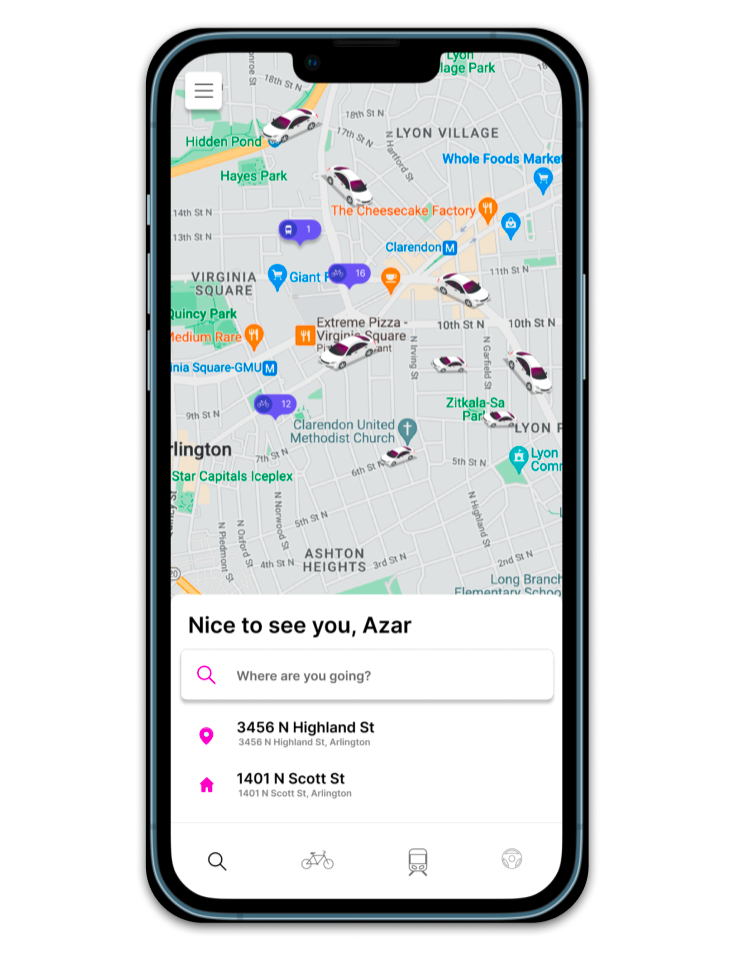
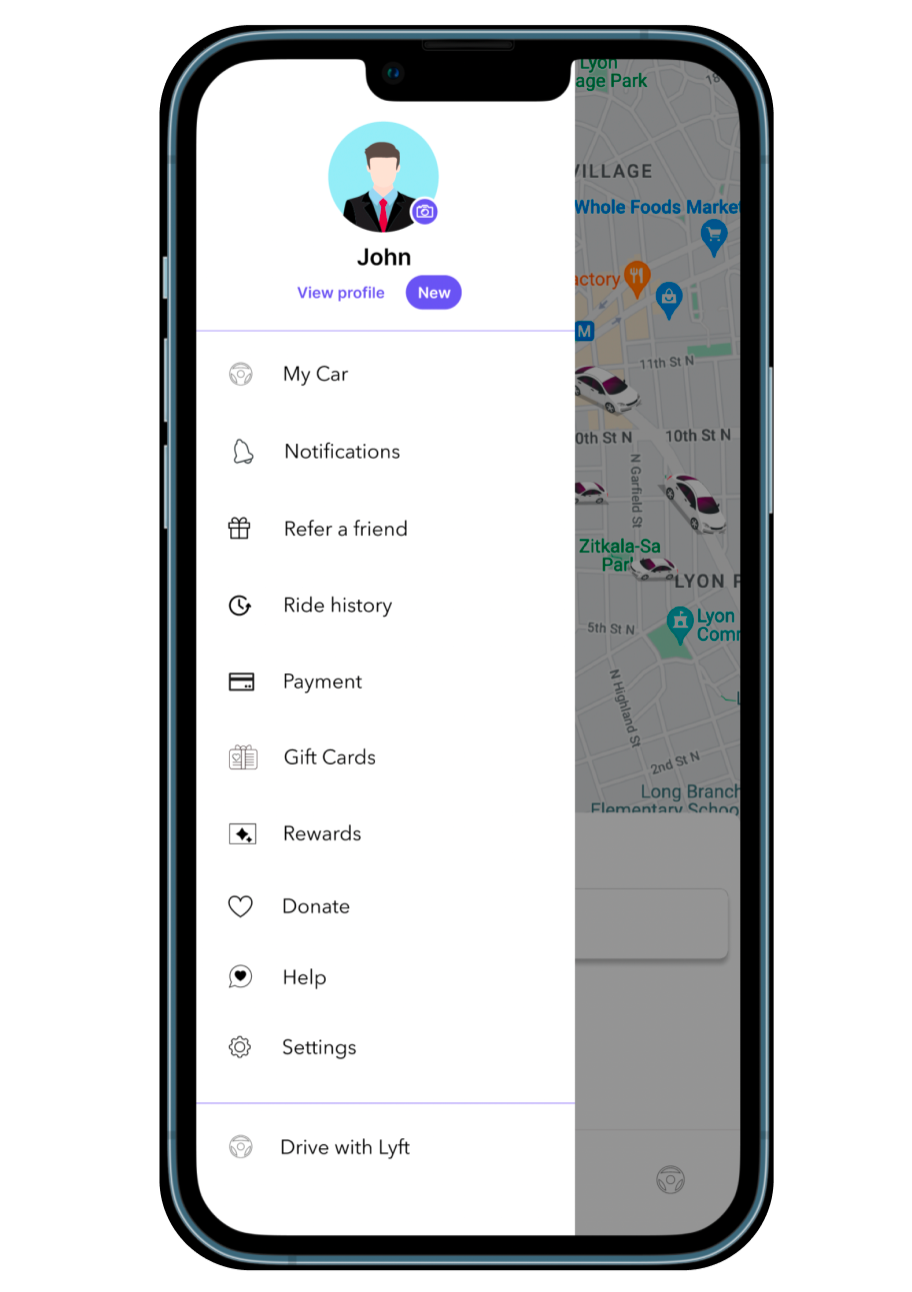
How might we make the rider app more accessible, affordable, and enjoyable for the riders? Started by discovering the pain points of the current rider app and proposing new features and solutions to improve user experience.
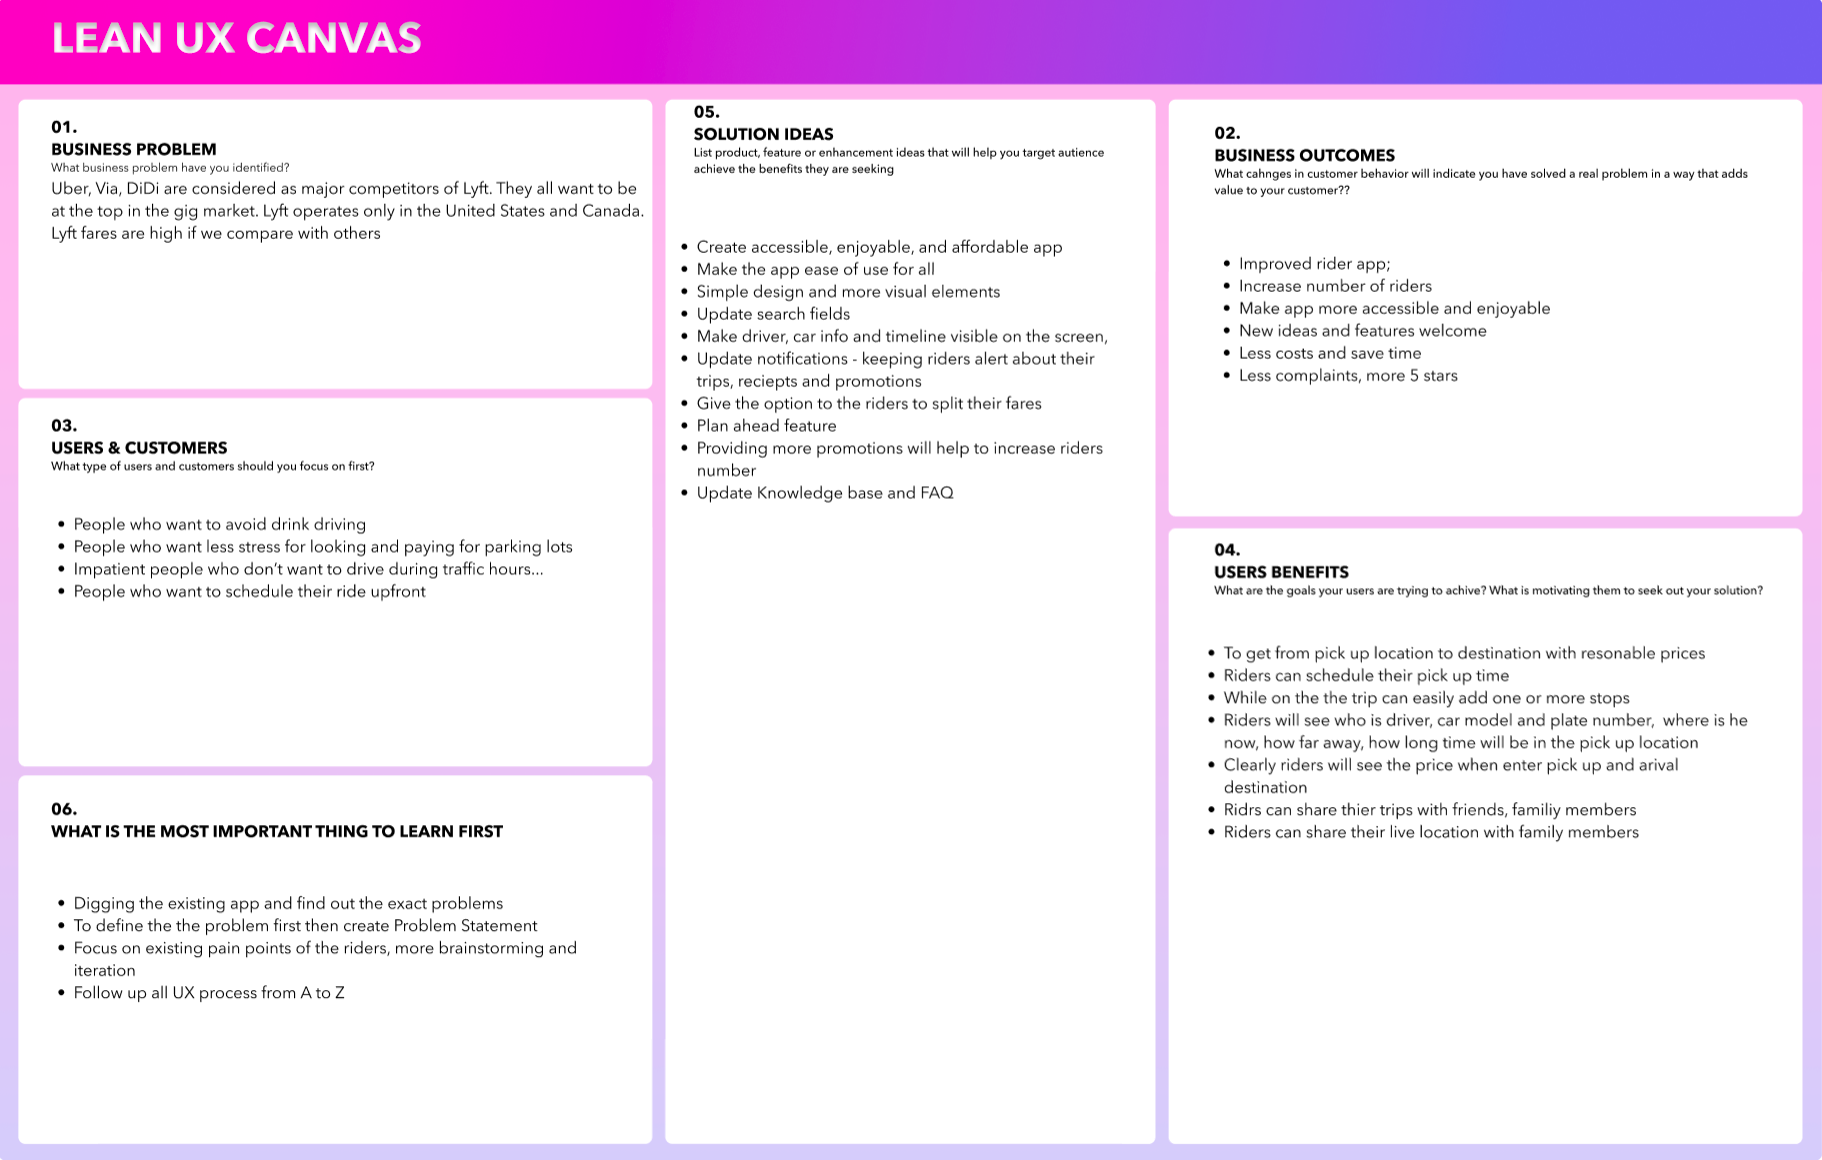
In the Discover phase mostly i use Canvas map which help me to know which direction has to take and also I’m able to identify which areas need more clarification. So I can easily identify the gaps relating to the riders and focus on that problem.
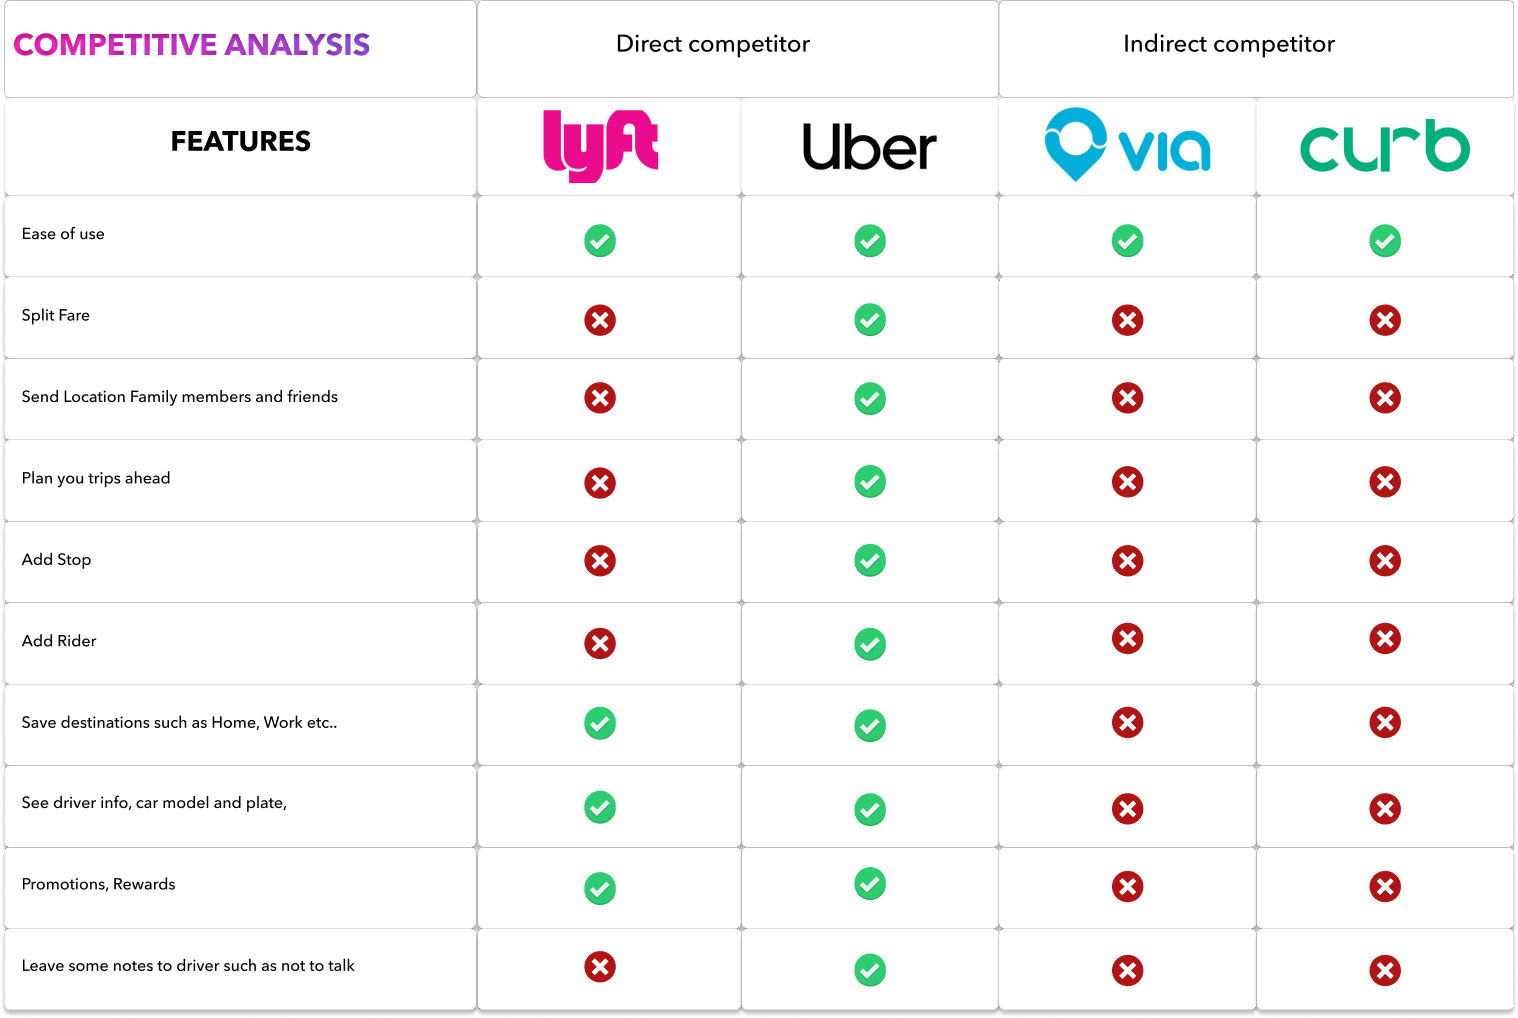
I started to look at Lyft’s main competitors for getting more clearer understanding of other apps in the market, and what seems to be working well. The competitors I decided to use for my Competitive Feature Analysis were Uber which is the main direct competitor and market leader. The Interactive Map helped me to better understand of users pain points, needs and what kind of features they need.
I found some key differences between Lyft and Uber (main competitor):
The main aim of conducting user research is to discover Lyft’s target user demographics, their pains, motivations and what they hope to achieve by using the app.
At the end of this survey, I also interviewed 15 people who have used rideshare apps and asked them to share their views on what they like in these apps and don’t like. These questions were instrumental in helping me to avoid bias. The respondents gave me answers that I wasn’t expecting, which helped open the opportunities for new feature development even further!
Below are some key quotes that have been pulled from the analysis:
“Mostly, I use Lyft or Uber instead of my car because of parking problems”
“I have faced some issues with drivers, especially in rush hour they drive fast, don’t stop at the Stop signs, missing Exits. It’s
frustrating when that happens.”
“Most drivers prefer short trips instead of long trips to complete their trips and get their promotions, so we face more
cancellation problems”
“To add a new stop I have to complete the trip and order a new one”
“I’m happy that there is a rideshare option, but every time I prefer a private ride if I’m in a rush. It also depends on how far
away my destination is.”
“I think drivers feel pressure to follow passenger instructions more than the app because they’re worried about their
ratings.”
“I appreciate being rewarded for being loyal, but I’ll always choose the cheaper option out of Uber and Lyft.”
“I mainly use rideshare apps when I’m out of town and don’t have my car to get around in.”
These interviewees were incredibly valuable. For example, they confirmed an assumption drawn from the survey data — that people are motivated mainly by cost and are not loyal to one app.
All the data gathered through the qualitative and quantitative methods showed us that we need to add some new specific features to the Lyft app.
To help build on this foundation of understanding the users, we conducted a short survey to try and identify pain points and successful features of ridesharing apps. The survey consisted of around 5-10 preliminary questions that would allow us to select our users for research best. We based our survey questions on the type of user attracted to use a social feature. Around 60-65 users were interviewed.
SOME QUESTIONS WE ASKED WERE…
Can you tell me about your best and worst Lyft experiences?
How often do you use Lyft?
How do you like Lyft’s service?
Does Lyft offer more promotions?
Do you like the existing Lyft rider app?
What kind of new features would you like to see in the new Lyft rider app?
What do you think about Lyft fares?
What are your expectations from Lyft?
Would you like to split your fares with friends or family members?
Why Lyft?
67 Respondents:
if you have two options, 52% of people preferred Uber over Lyft (48%) because of Uber’s features
65% of respondents say Lyft cars are clean and new
72% of respondents say Lyft drivers drive safely and Lyft is more safety
66% of respondents say Lyft fares are getting high more than others in the surge time
75% of respondents say they don’t see more options in the rider app; we are not able to add new stops, we are not able to share their rides with others, and ey are not able to plan our trips…
This survey also proved that users employed rideshare services for many reasons. Some of the top reasons for using rideshare apps, people cited:
Avoid drinking and driving
Avoid having to find and pay for parking
To get to the airport
Commuting
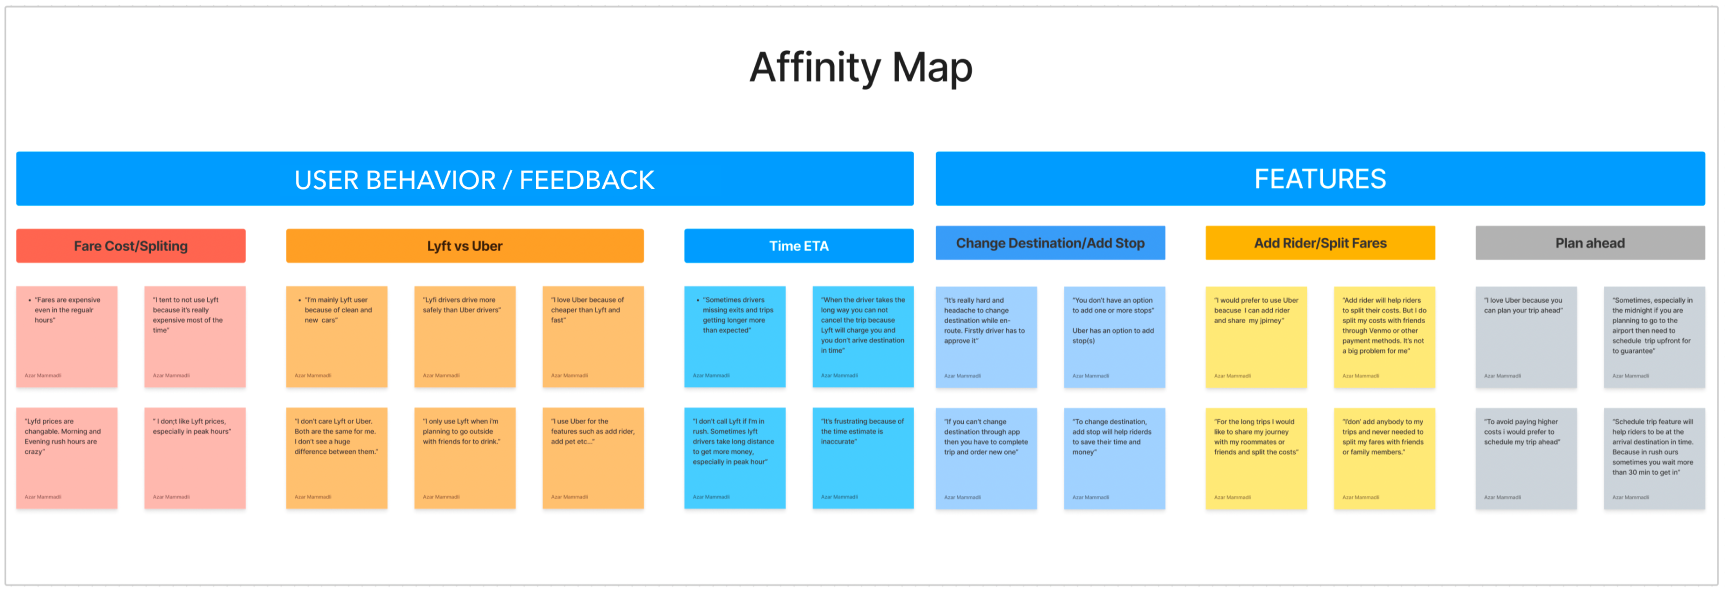
After I collected some rich data from the users, i started to create Affinity map for gettin more clearer picture and find out common problems and pain points. I break down in two main categories: User Behavior / Feedback and Features. Becuase of on this project we mainly focsud on the features of the Lyft rider app. In the Affinity map it seems clearly that riders’ common choice of adding new features to app such as add rider and split payment in the app, adding one ore more stop without completing the trip – save time and money, schedule trip ahed and arrive to the destination in time.
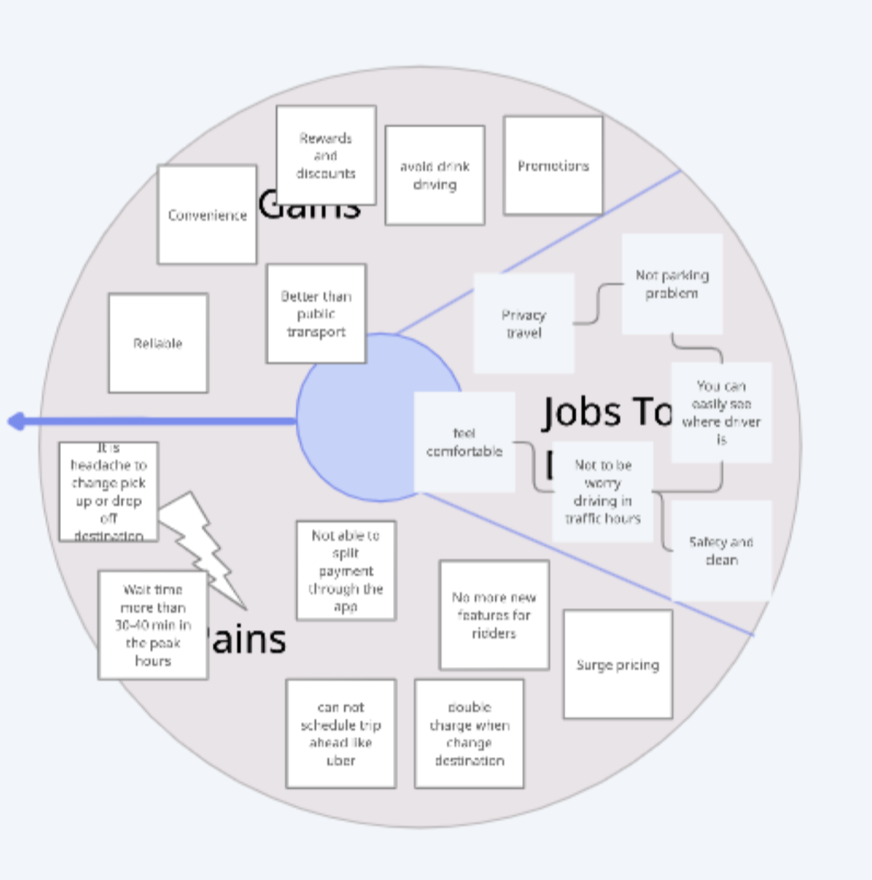
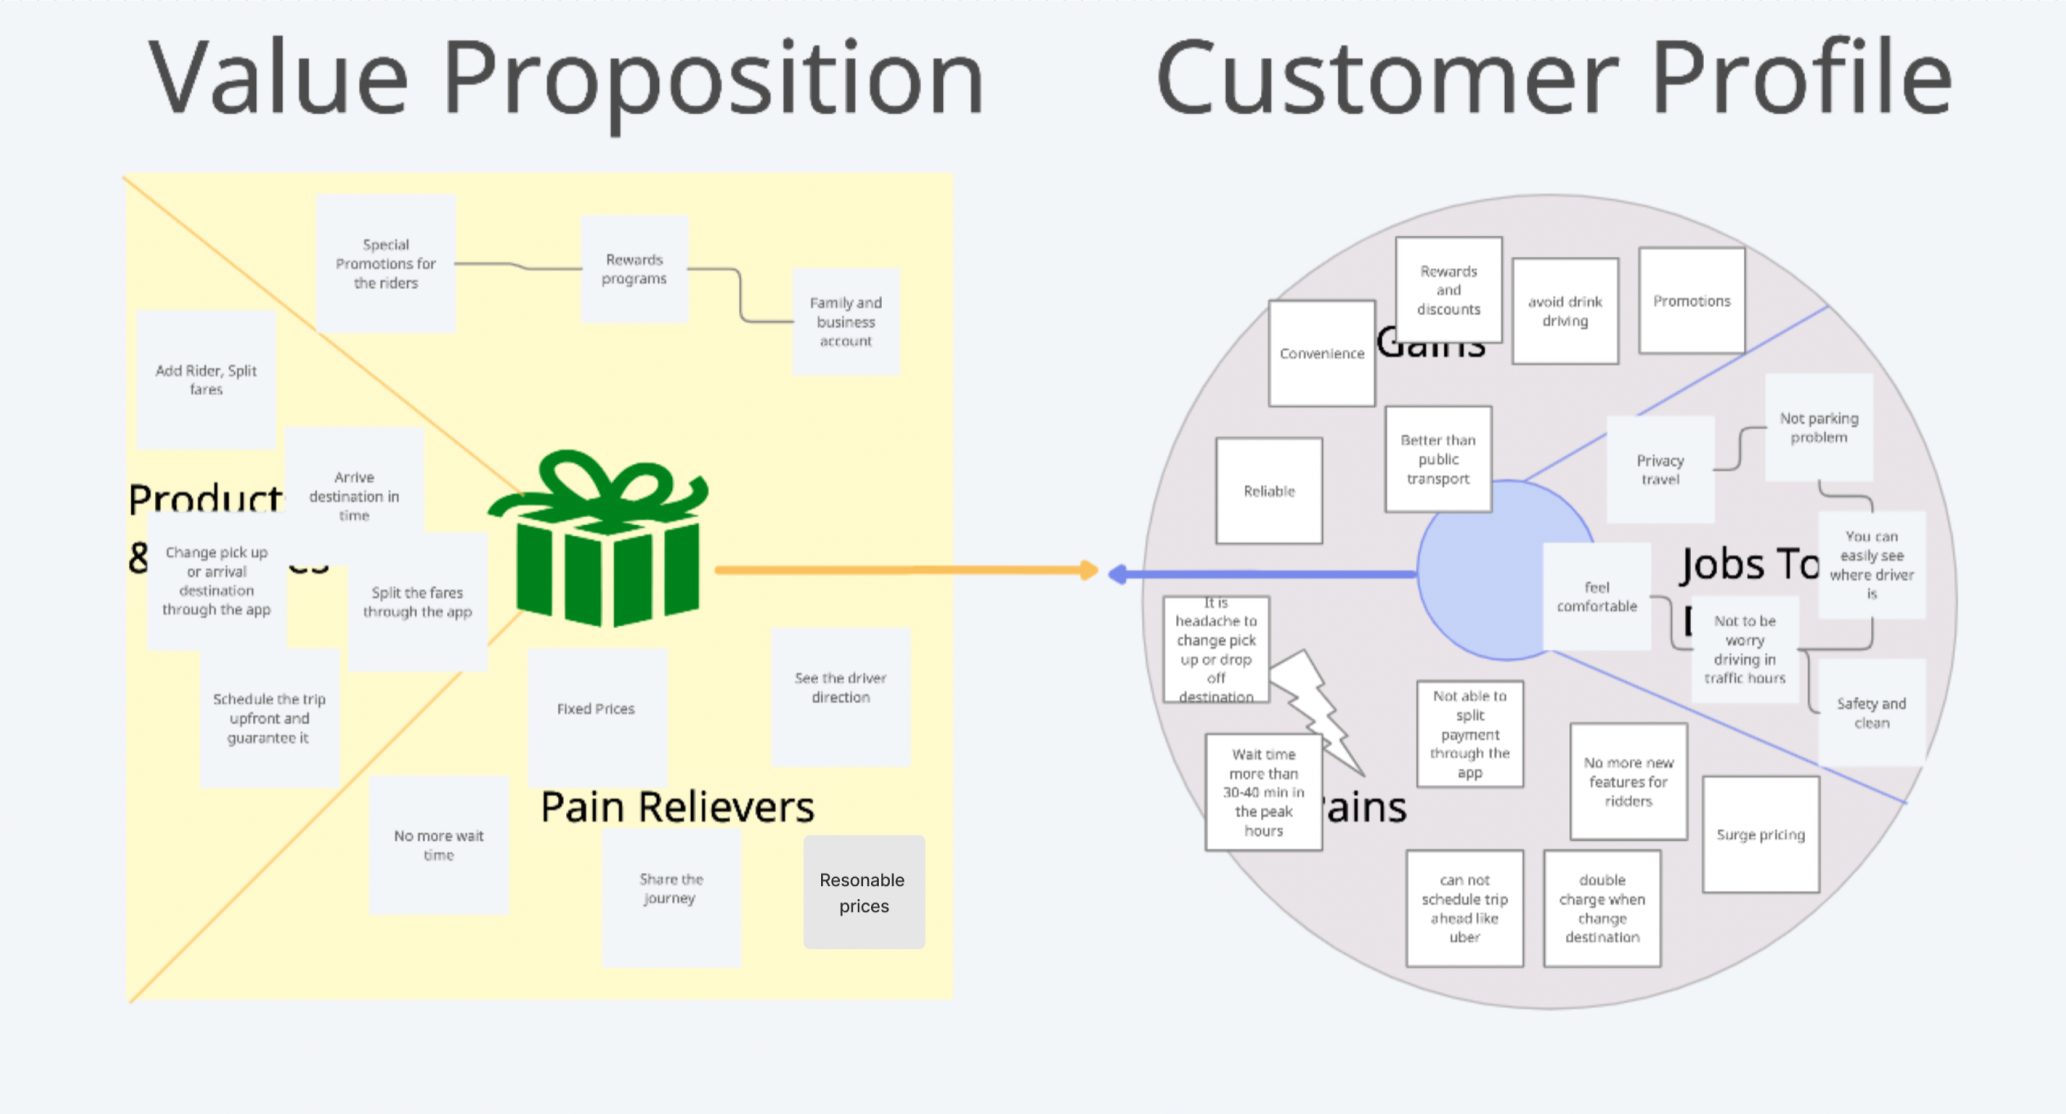
It is the stage where my project started to get momentum and let me focus on customers’ gains, pains, and the user jobs to be done. The Value Proposition helped me see the actual scenario and understand what kind of new features we need to add to the rider app.
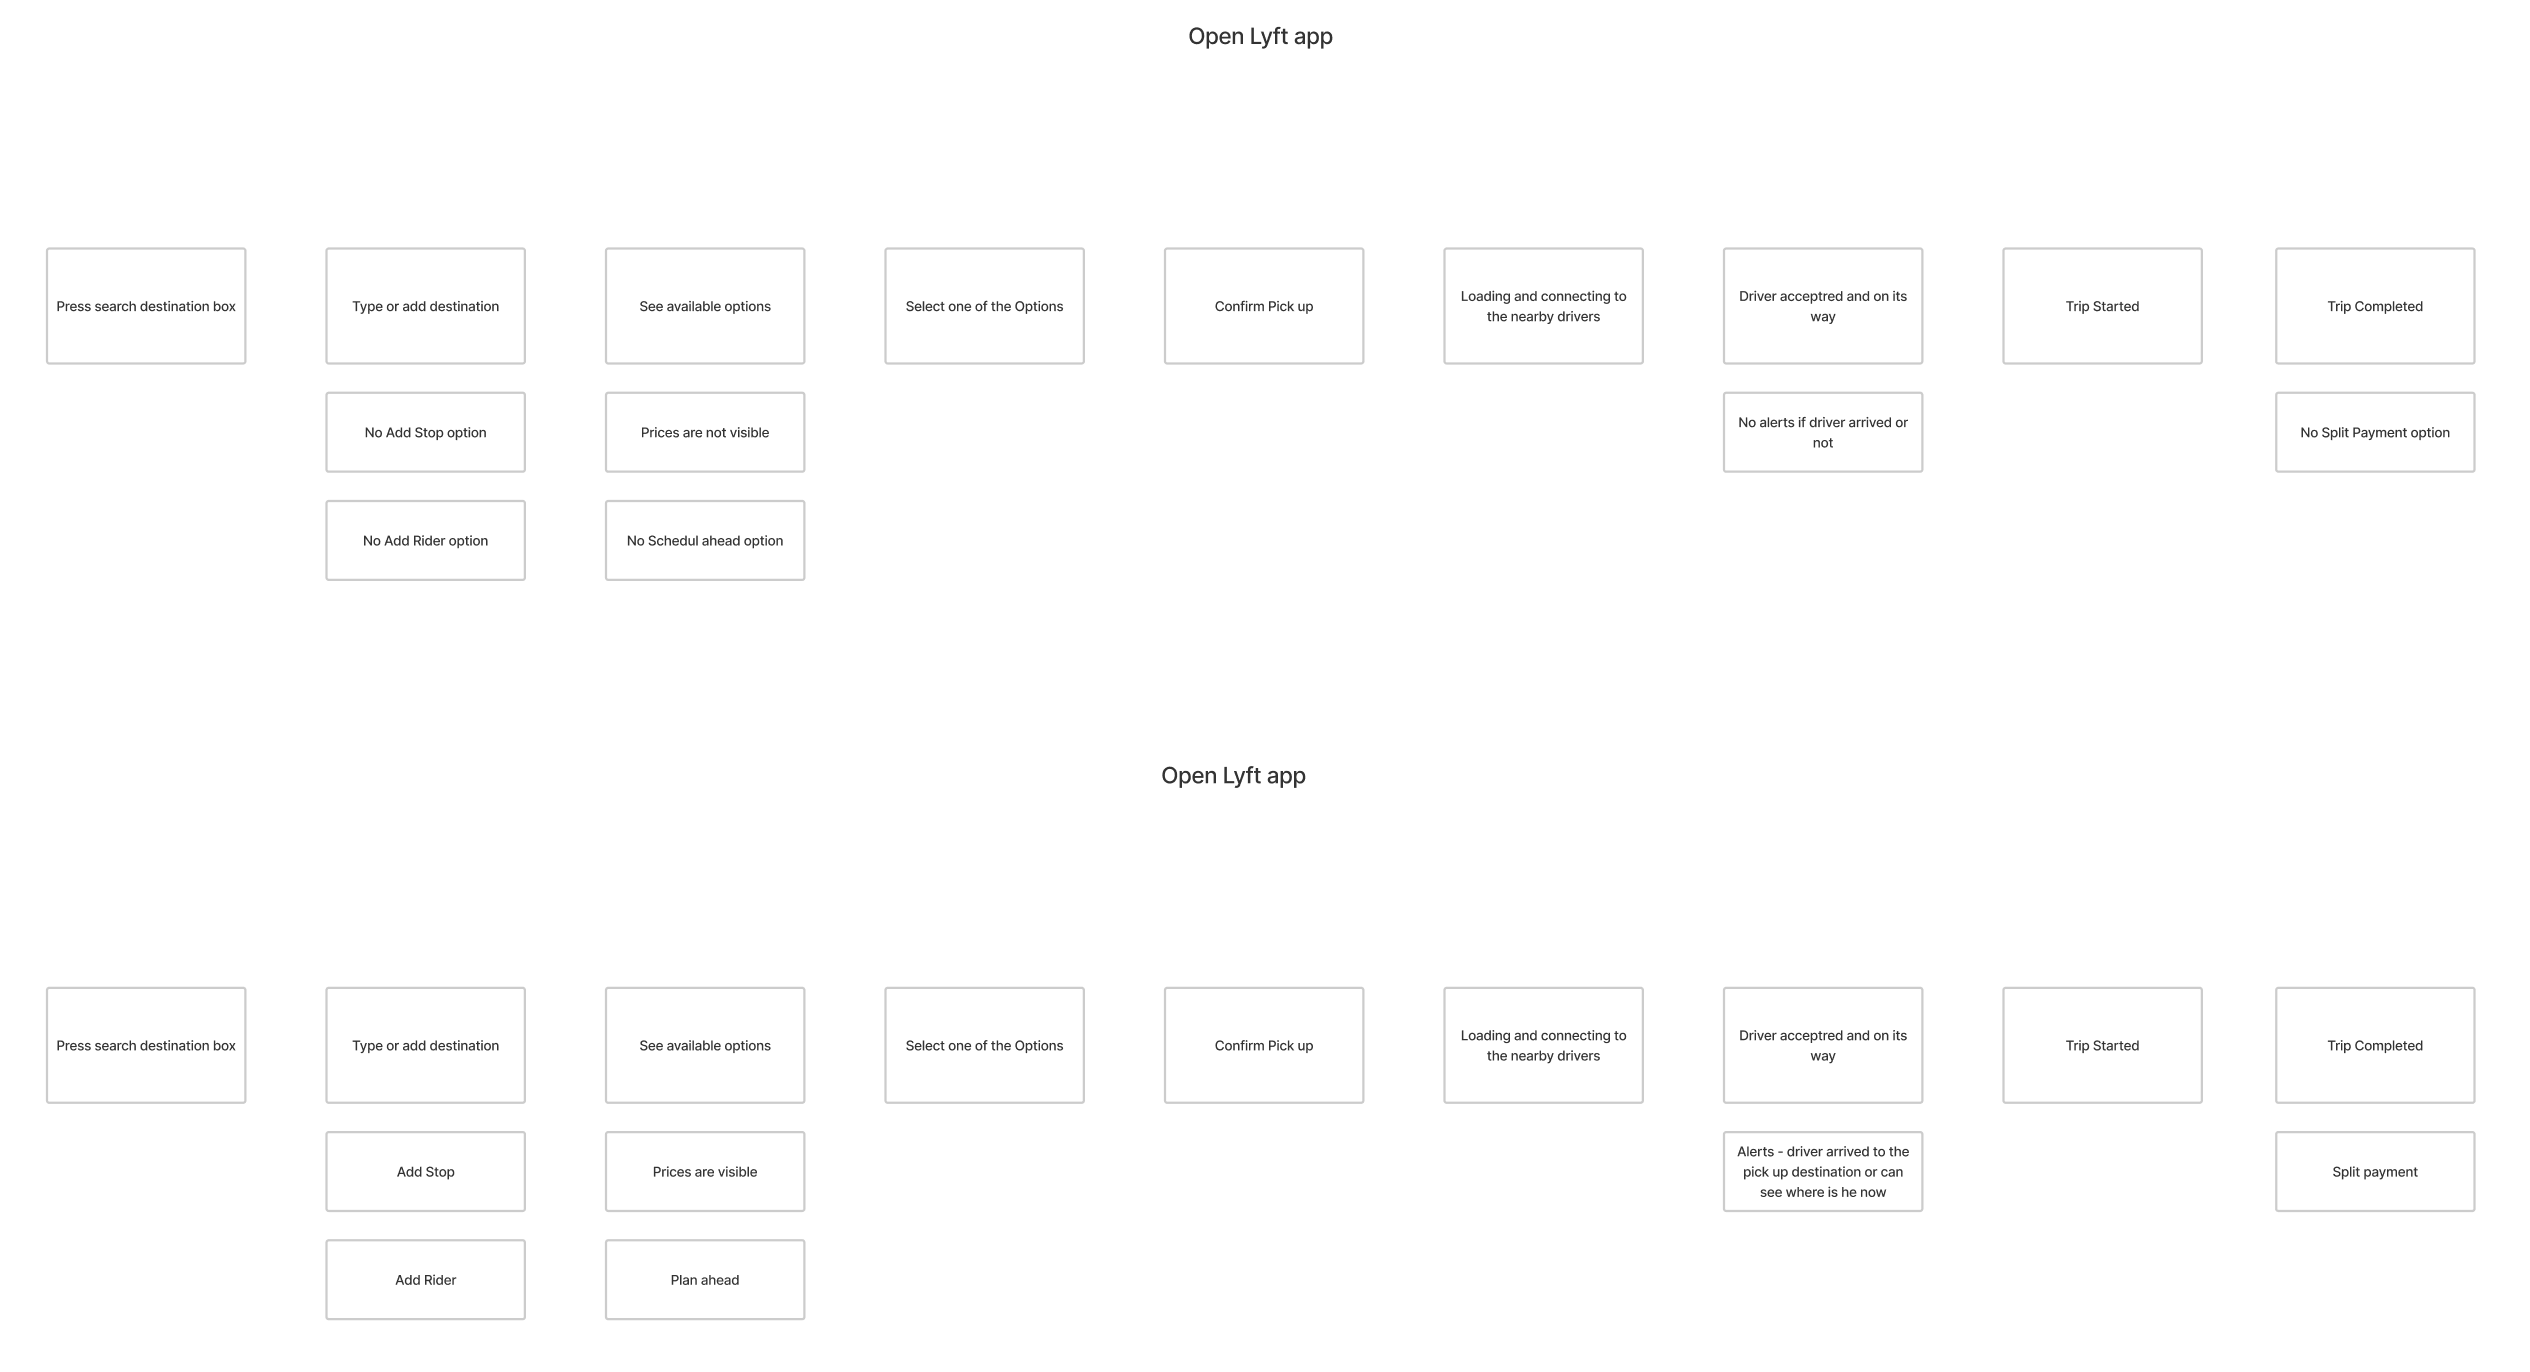
Then I dove deep into the task analysis to examine the existing Lyft rider app, and I started to break down the whole process from the ordering to completion. In this way, I can see the scenario of what steps users take to achieve their goals. Because of I will determine what kind of features are needed or improvements could be made to enhance user experience.
Initially, I started analysis from the point of view of users who will add one or more stops to their trips for picking up or dropping off friends or family members, scheduling their trips ahead, and adding riders to the trip to split their cost and save savings…
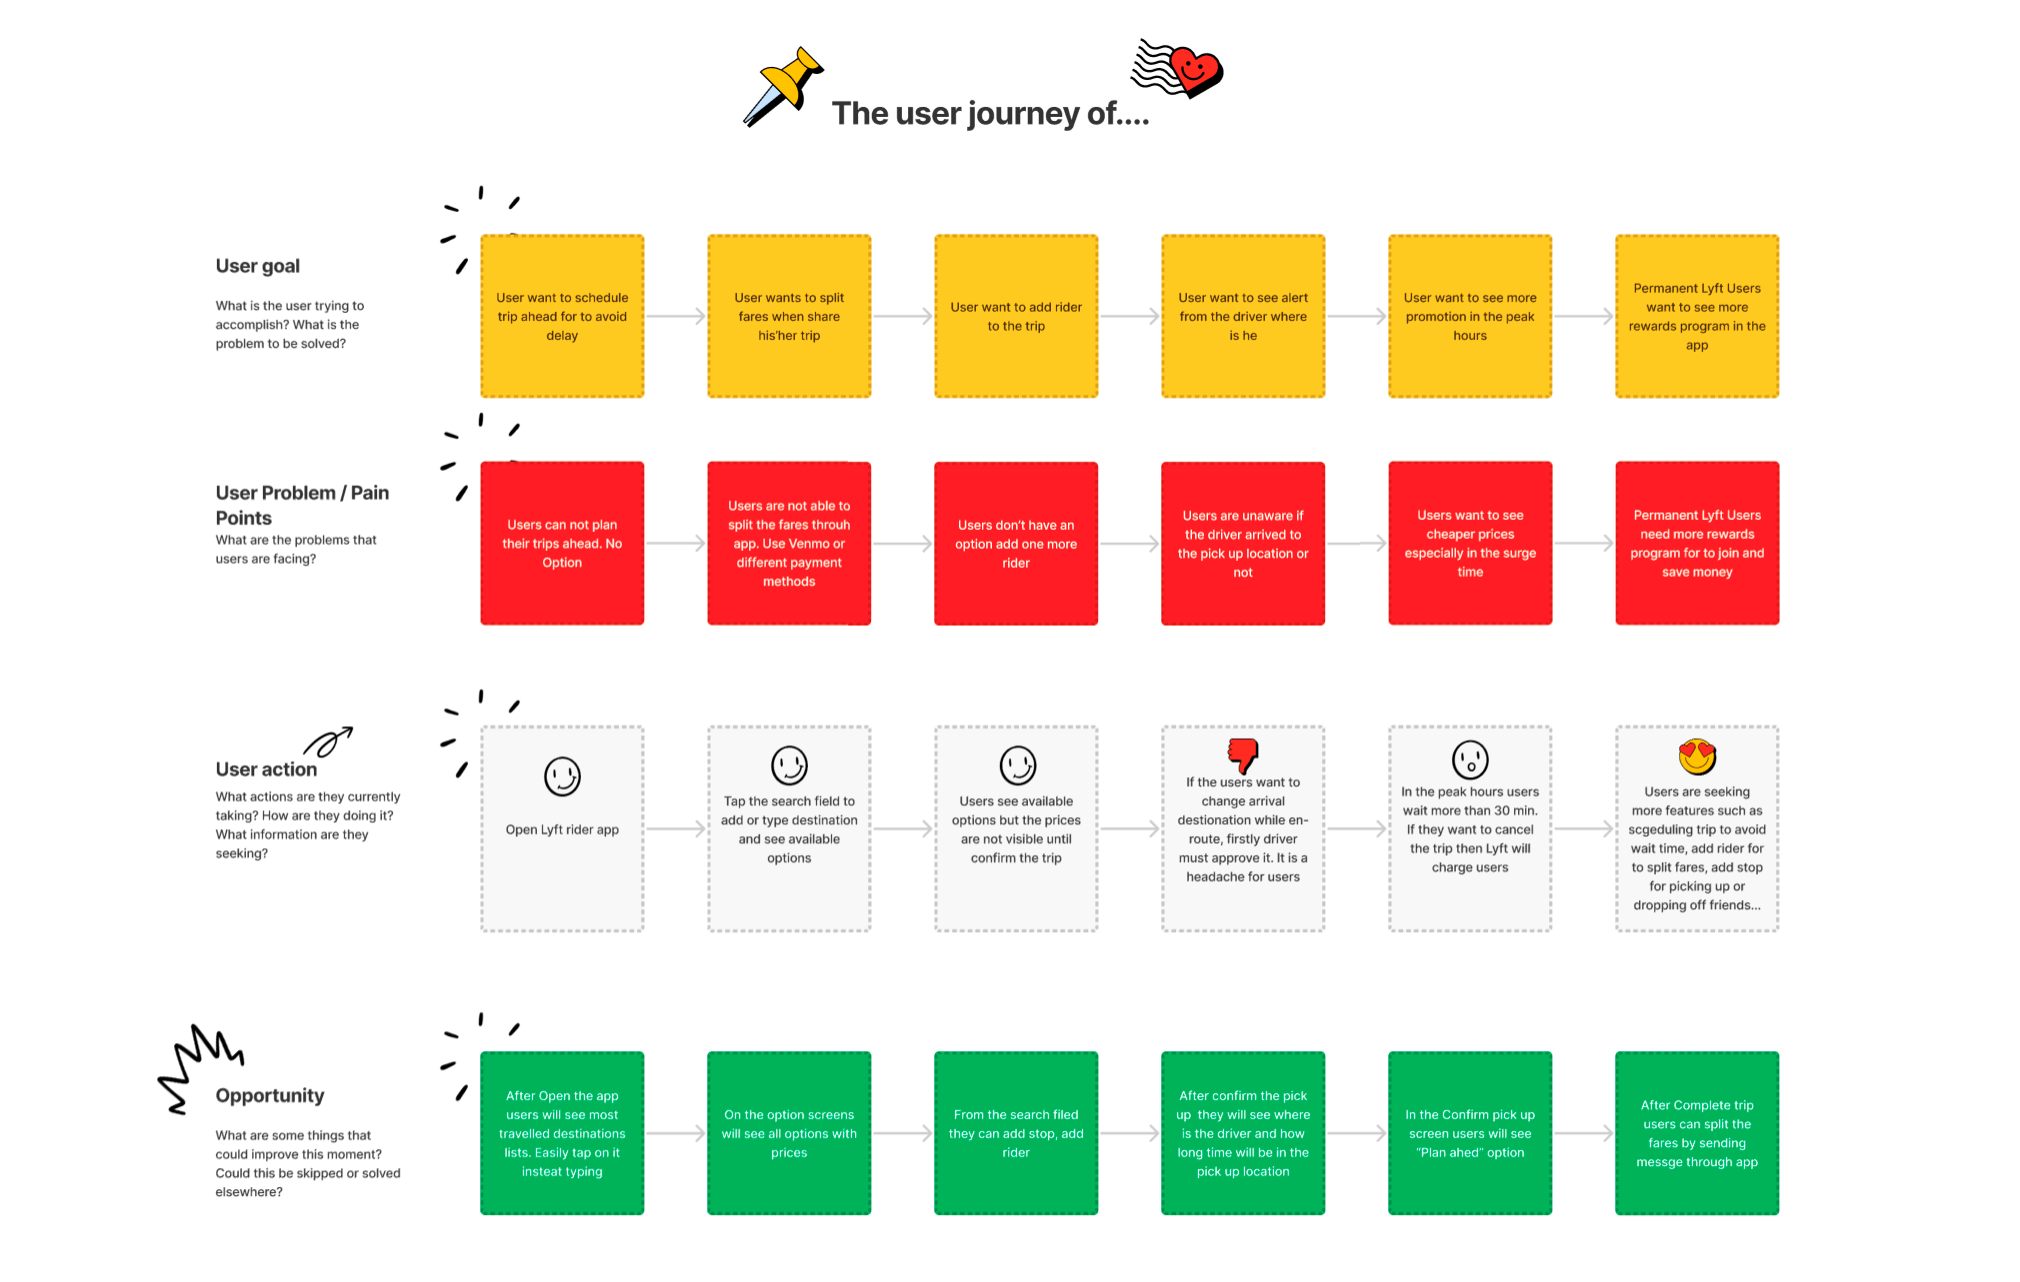
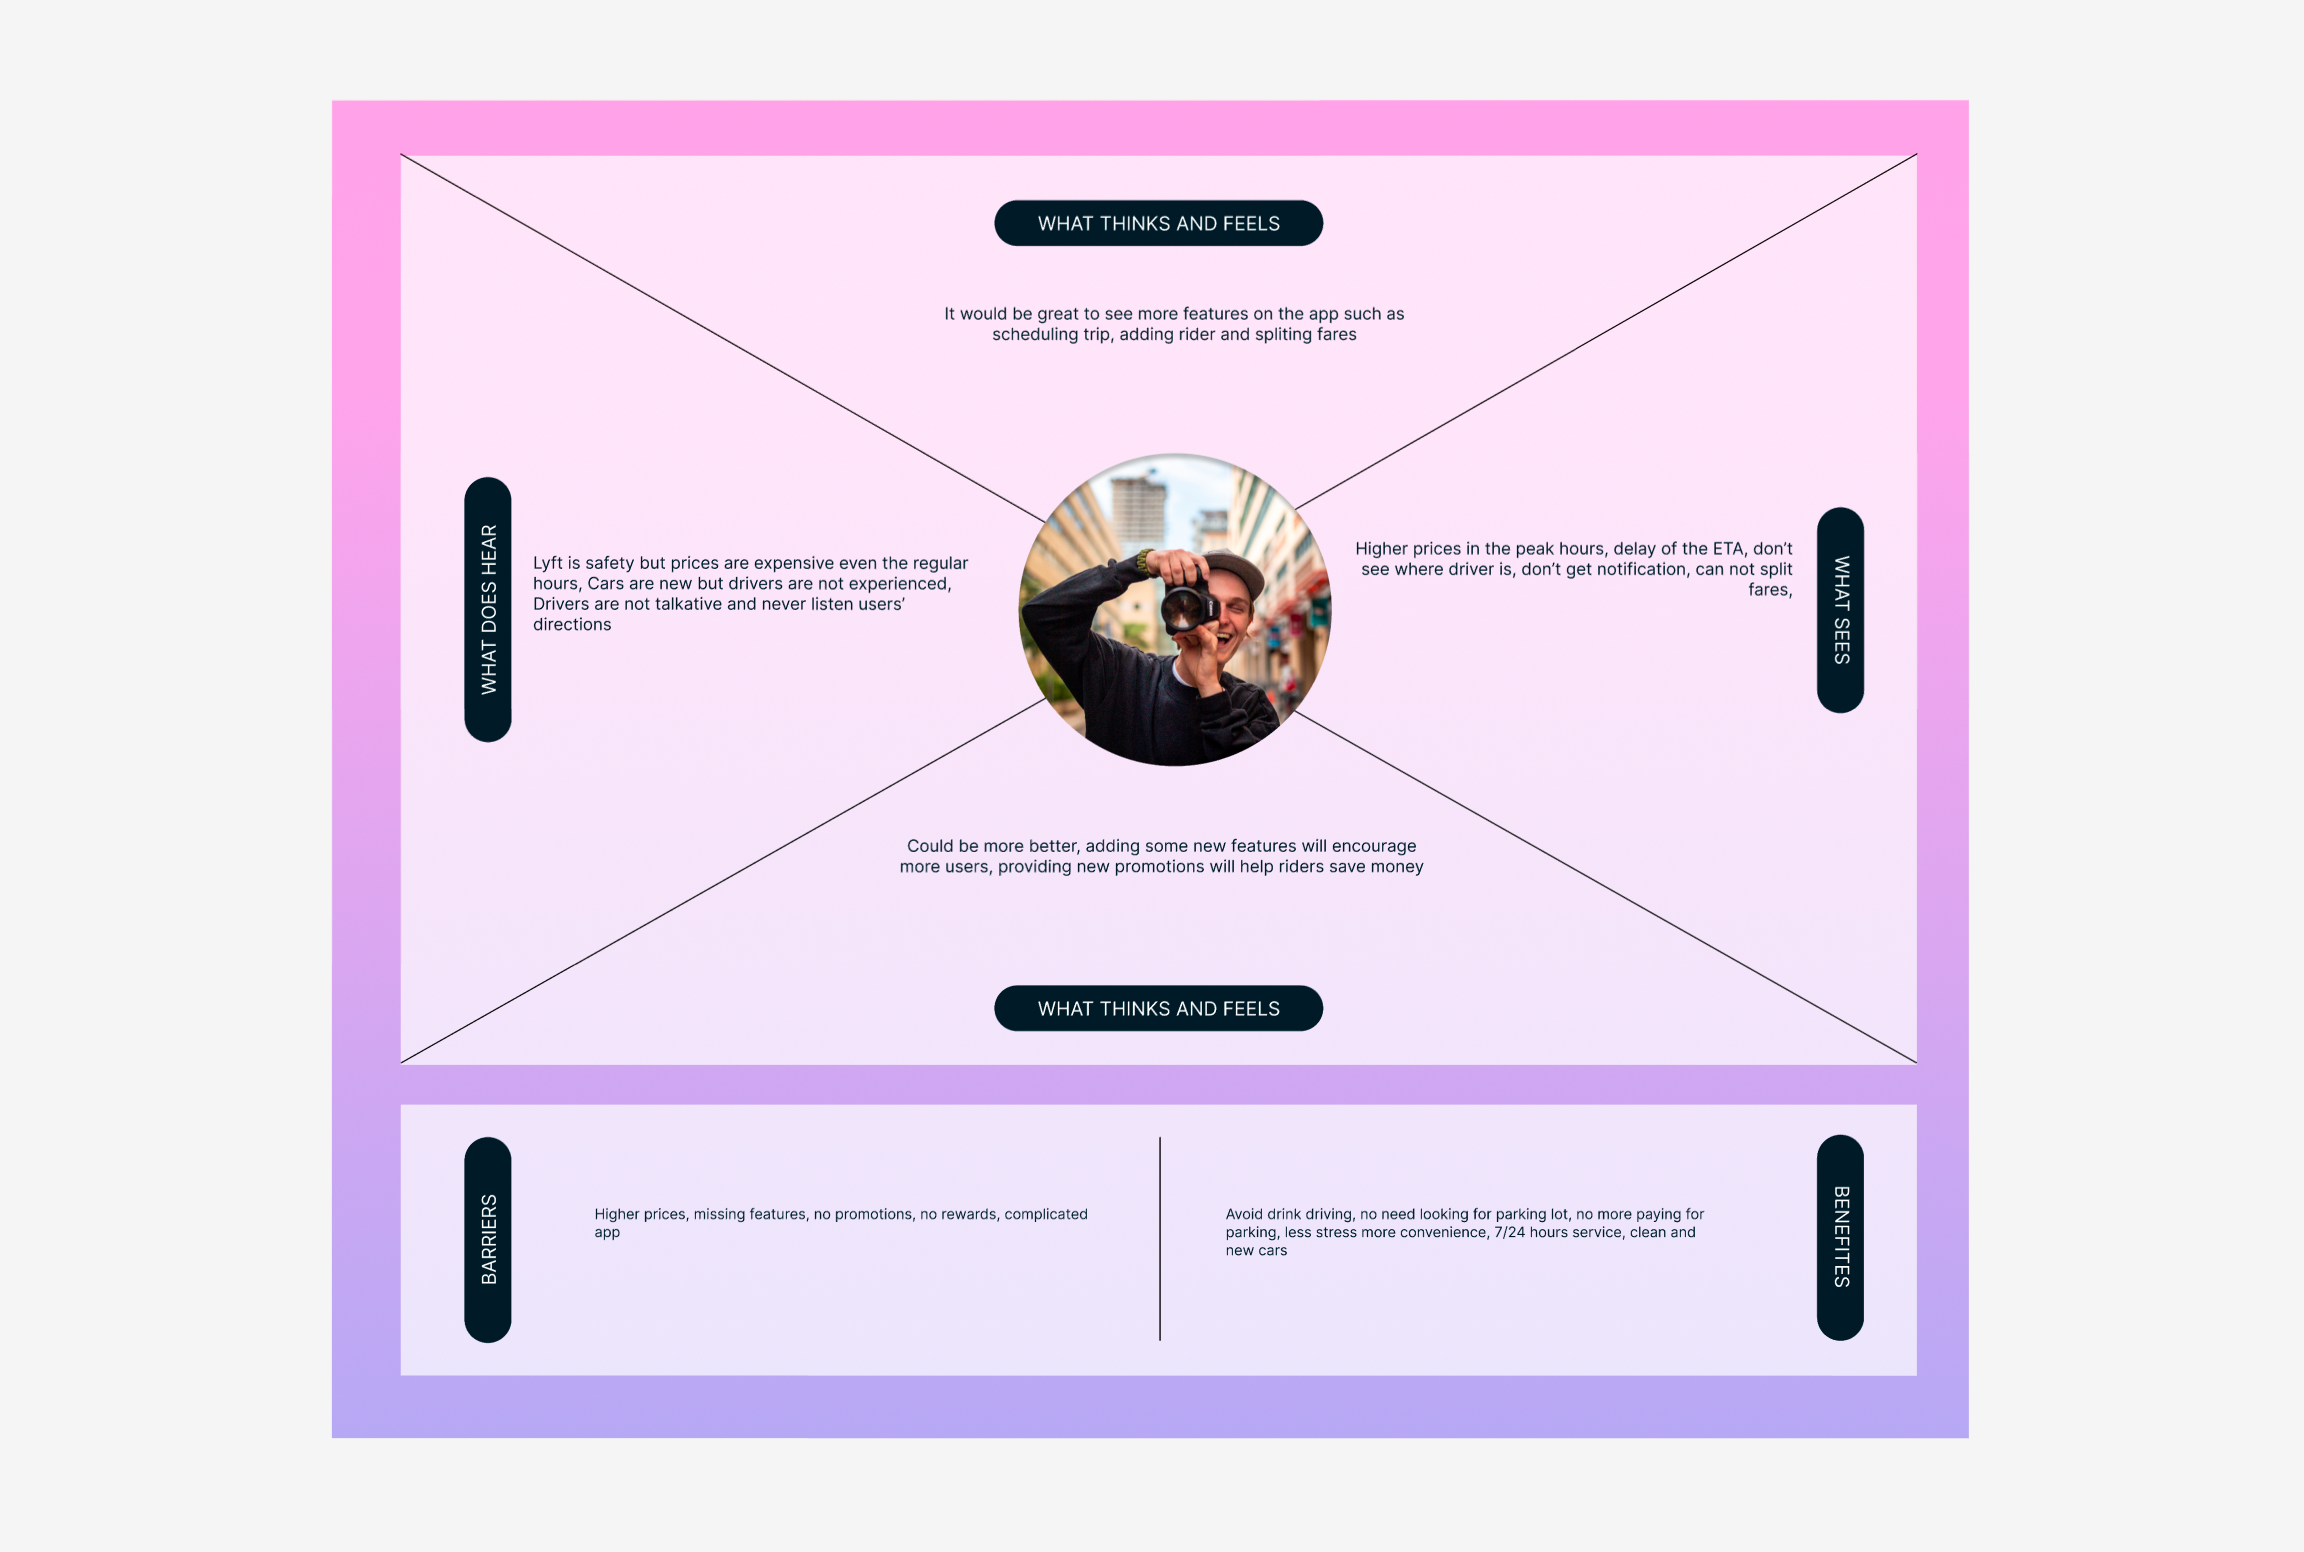
After Task analysis, we immediately started working on the User Journey map, a handy tool. Why do we need a User Journey map? It shows where users’ journey starts, what the user is trying to accomplish, what the problem is to be solved, what are the existing issues that users are facing, what are users’ actions, what they are seeking in the app, what opportunities we offer to users…We see severe frustrations throughout the users’ journey in the current user experience, and we focus on solving their problems and needs.
Most Lyft users’ common complaints are pricing, especially in the peak hours; users who are going to the same destination want to share their trip and split the costs; users who are traveling most of the time want to schedule the airport trips ahead and be in time at the destination otherwise will
After a long brainstorming phase at least we have already filtered all ideas and ready to complete the Value Proposition Canvas.
To ideate better solutions, we used the “How Might We..?” method to reframe problems. In this scenario, the issues can be reframed as follows:
How might we reduce the user’s problems and keep them stress-free?
How might we encourage more users for Lyft?
How might we bring the new features and make them useful for riders?
These newly formed questions helped to kickstart the ideation stage — something we were able to collaborate on with the team. Joint brainstorming and creativity enable us to create better ideas and solid solutions.
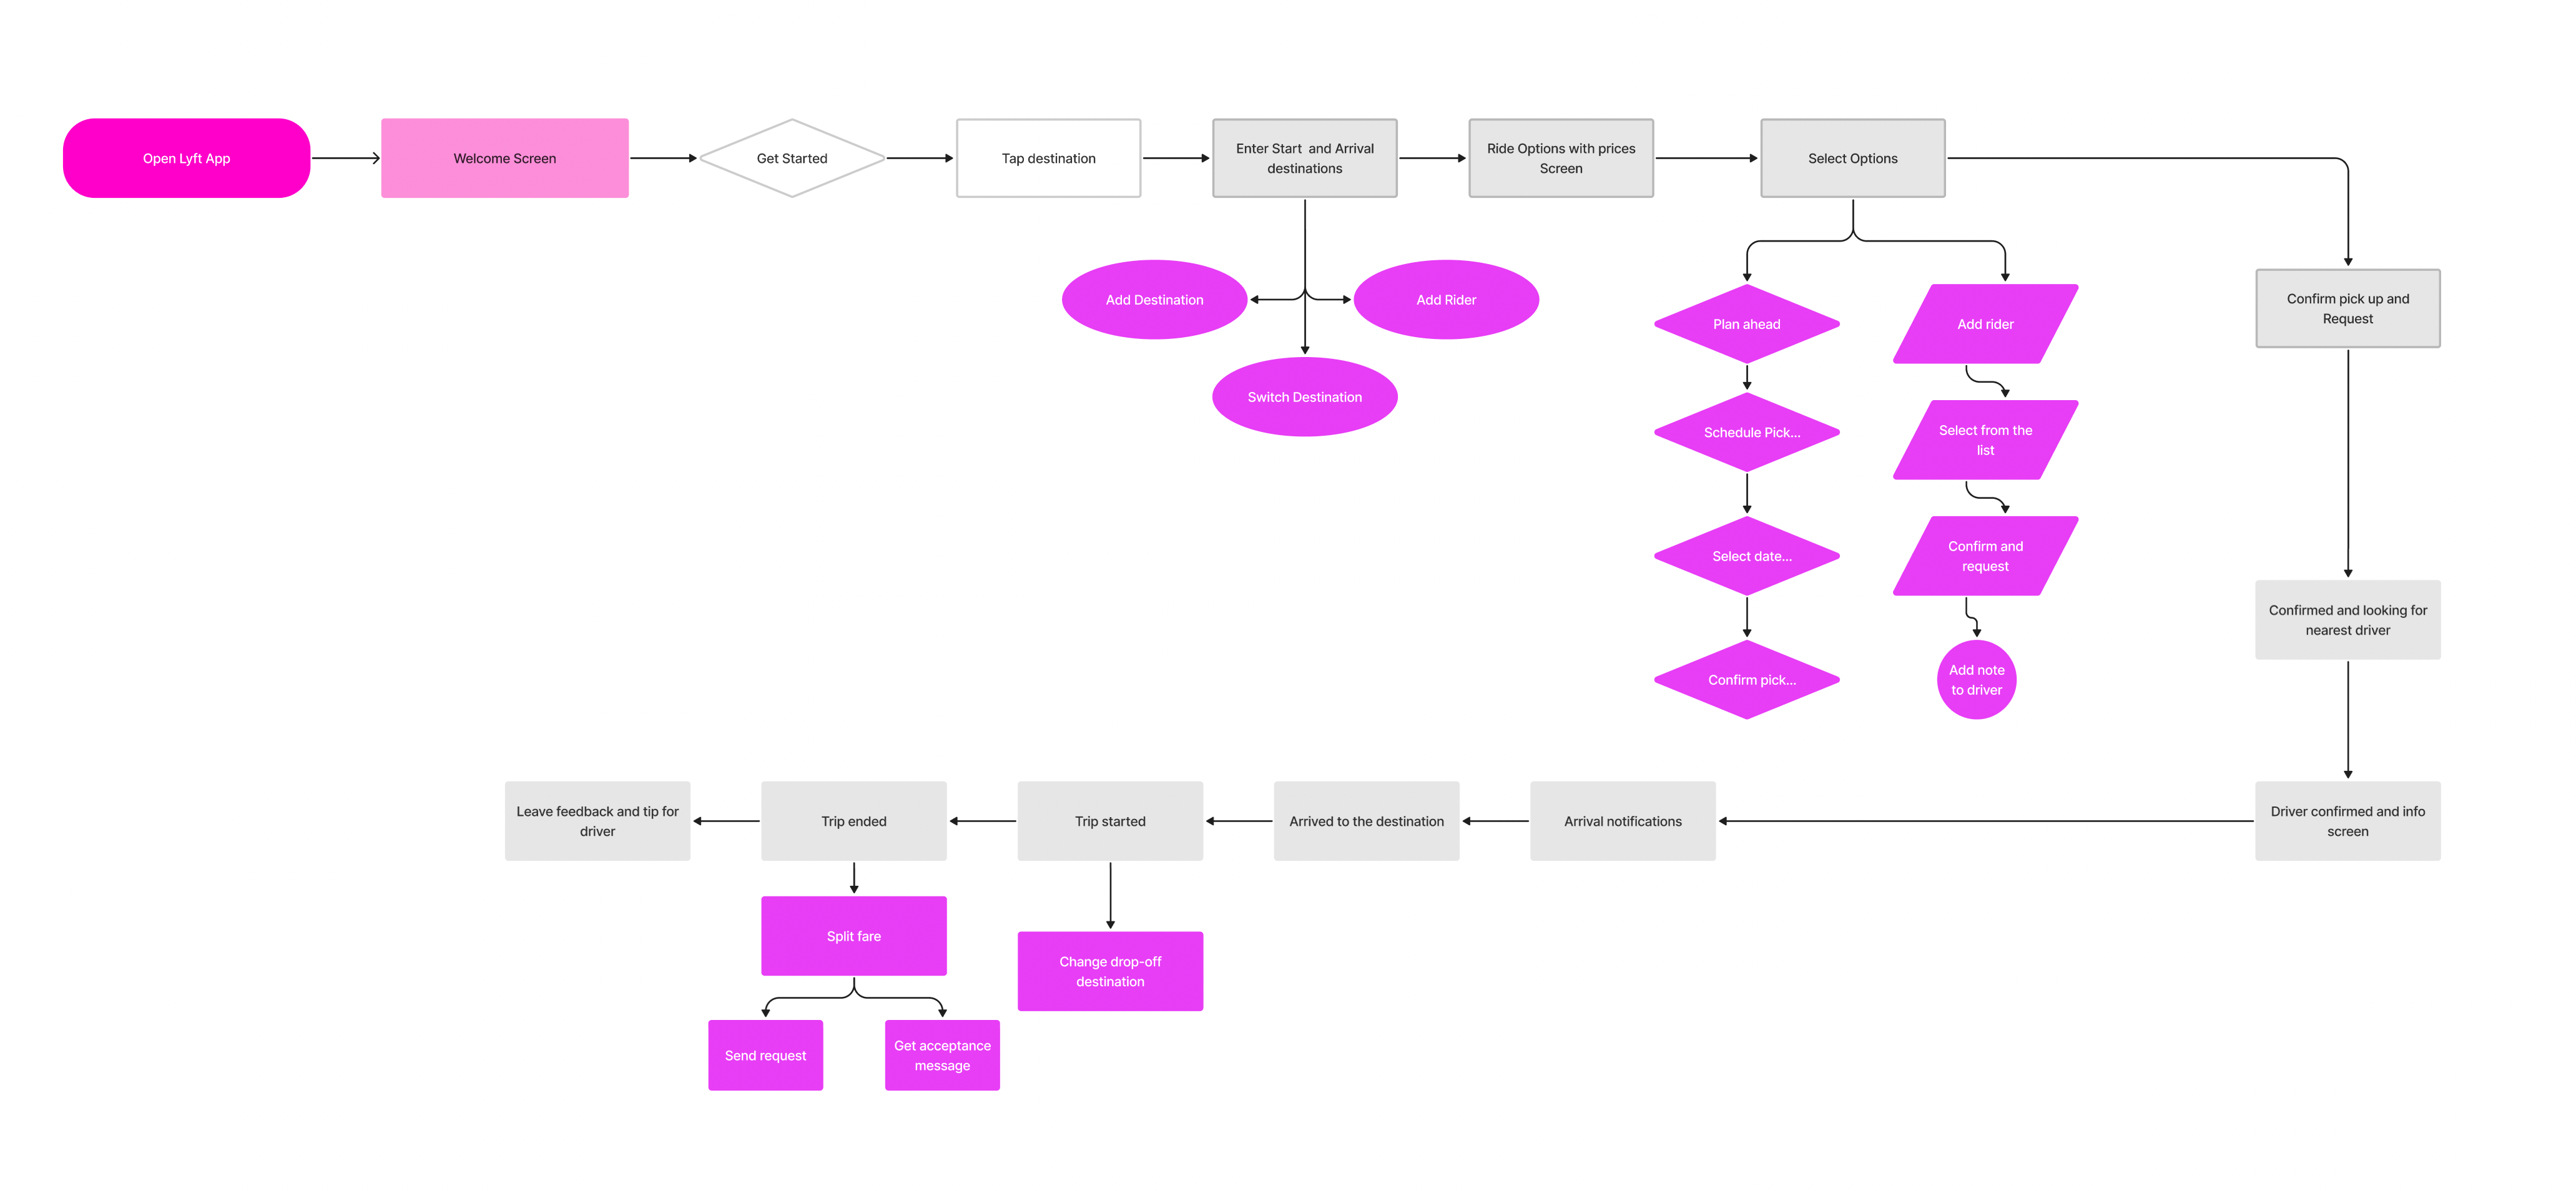
After settling all the new features, I started to create a user flow map, which is step-by-step outlining what a user does to finish a task or complete a goal through the app.
I created the mid-fi prototype in Figma and used the Maze plugin to run my initial usability testing with 34 users; I completed the initial test with a 97% success rate and also noted a total of 565 clicks through the mid-fi screens. I got positive qualitative feedback.
You can prepare a static prototype and have more time to work on the design in a short time before the test.
You can make design changes more efficiently during the test.
Low-fidelity prototypes put less pressure on users.
Stakeholders recognize that the work isn’t finished yet and is just initial testing, and after feedback, designers can add some changes or fix the problems.
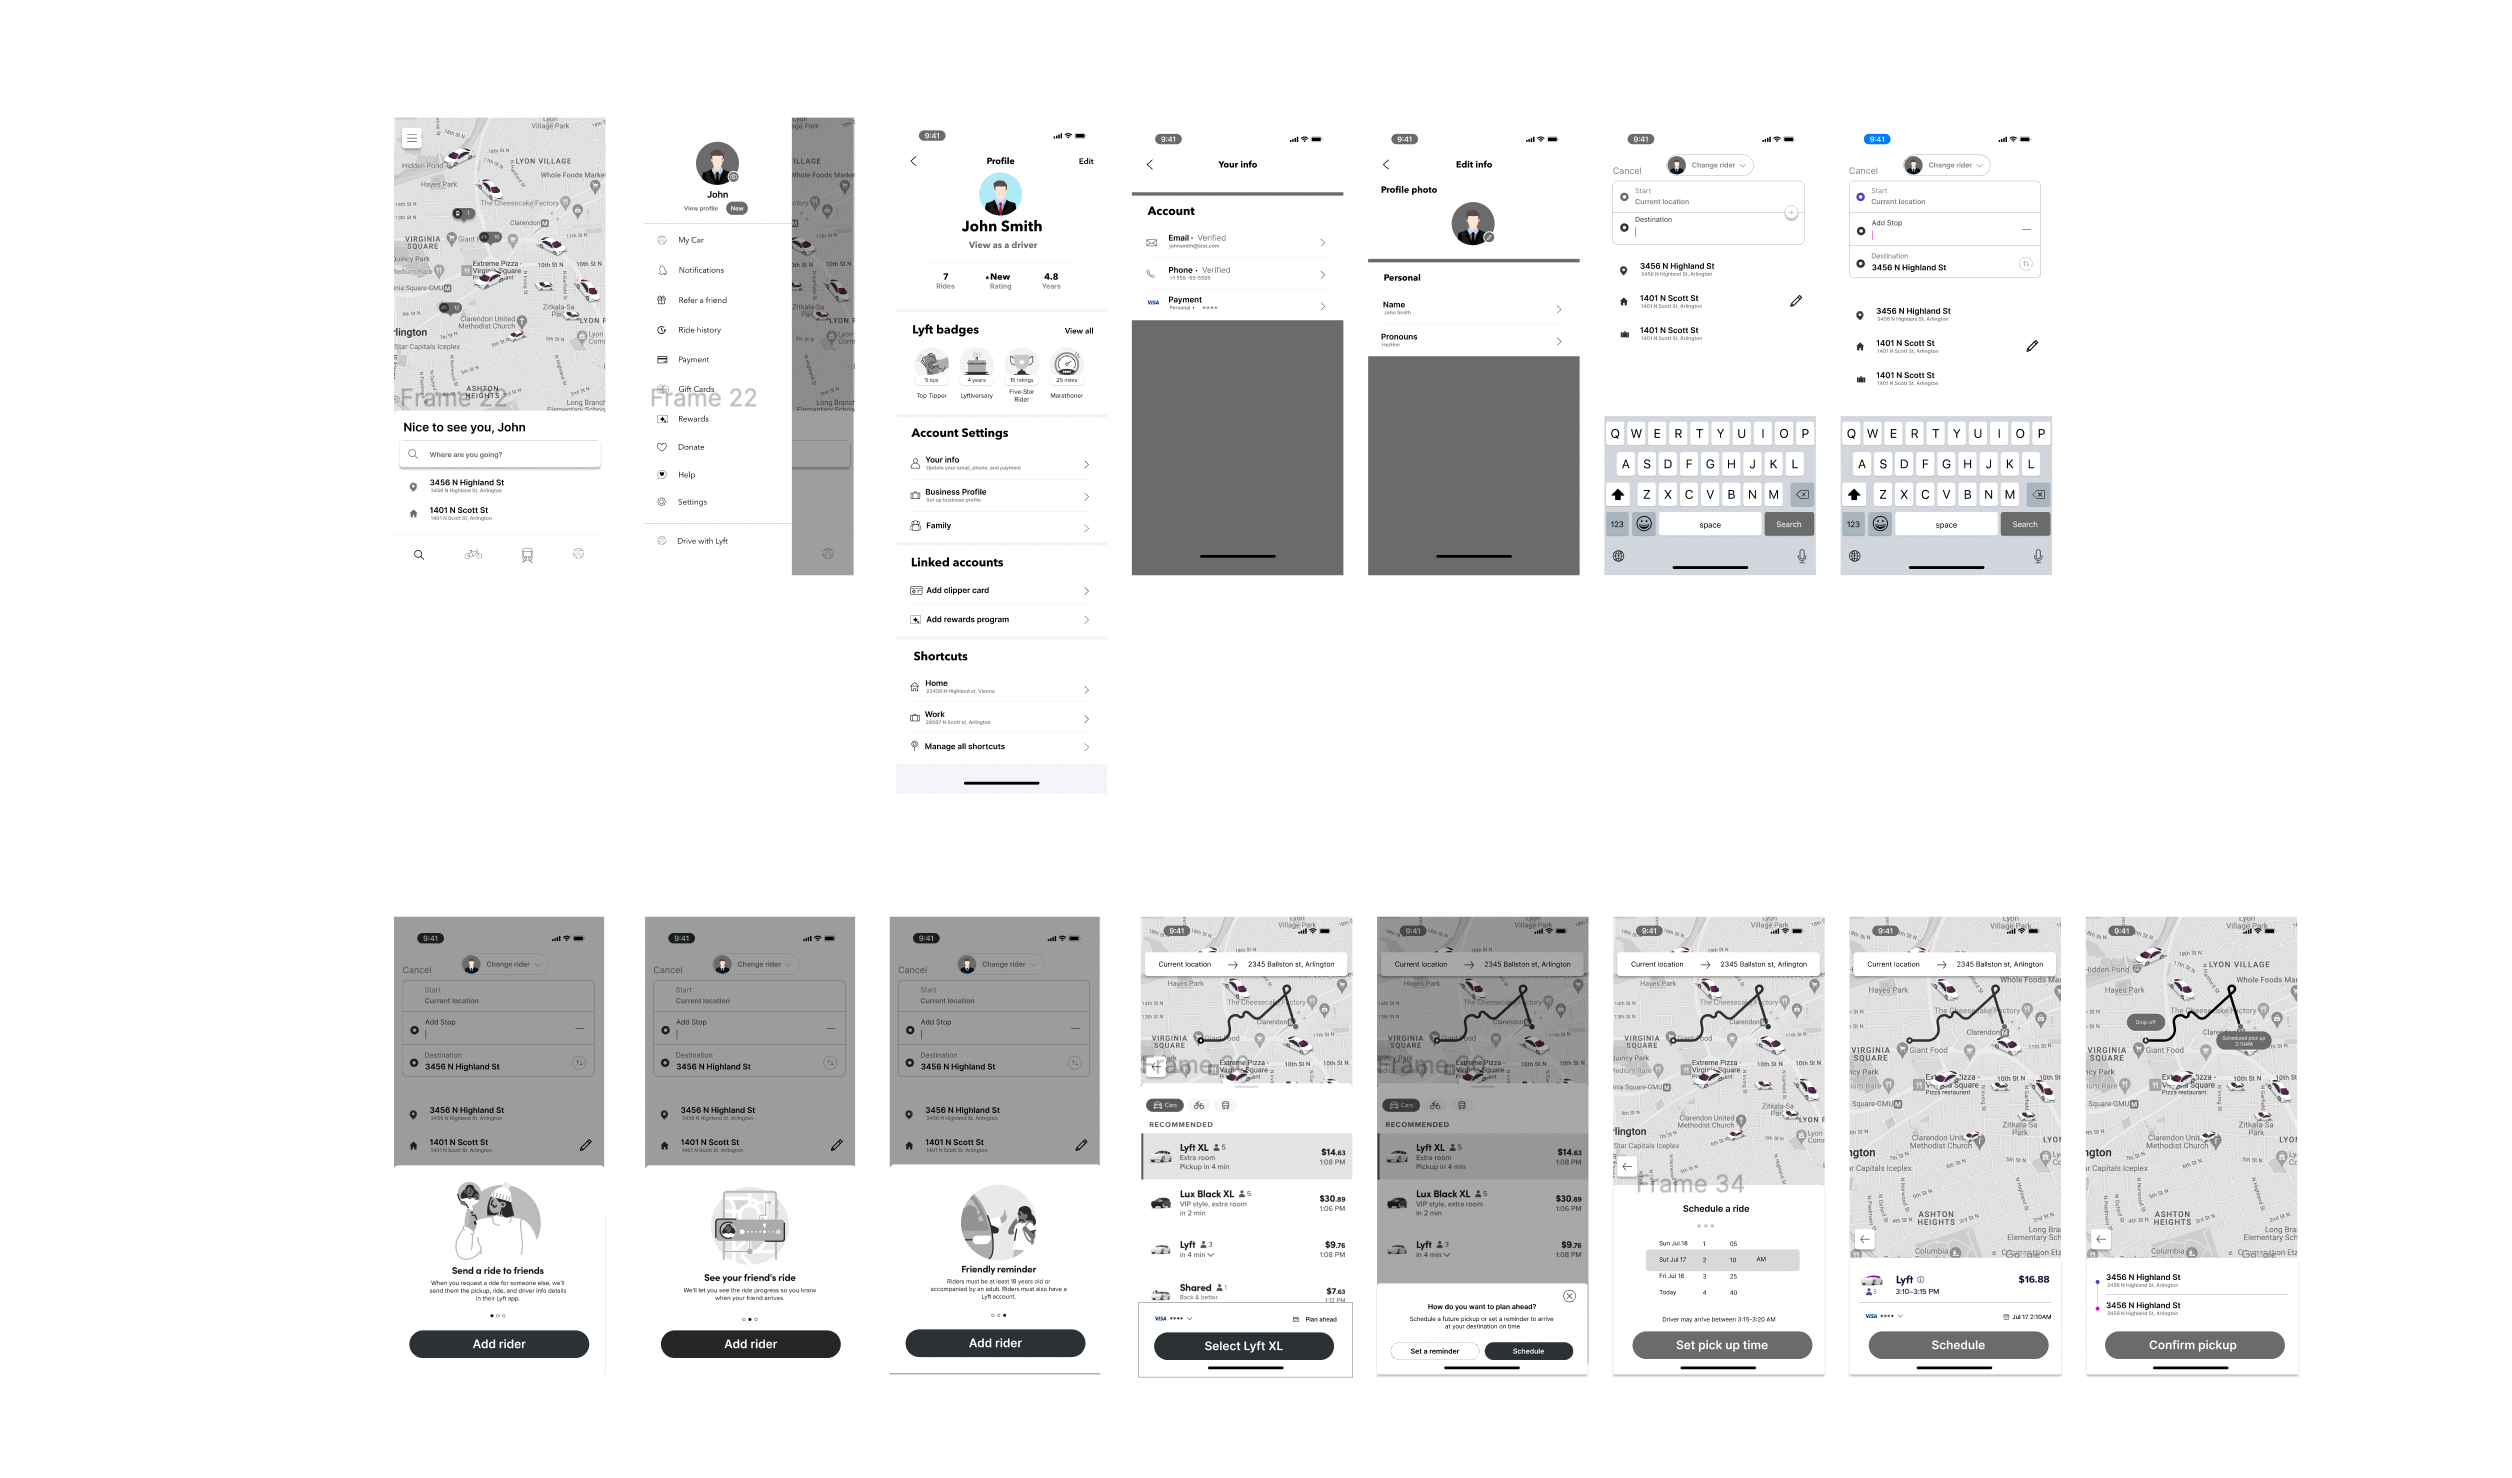
After collected positive feedbacks from my mid-fi prototypes, I started to work on the interface design and improved the visual elements. Created Hi-Fi Map